
Understand your Kubernetes cost drivers and the best ways to rein in spending
In the previous blog post in this two-part series, we discussed the critical signals you need to monitor in your Kubernetes environment to ensure optimal resource provisioning. These signals include high CPU and memory utilization, frequent pod evictions, slow application performance, and other indicators that your resources are over- or under-provisioned. Monitoring these signals is essential for maintaining an efficient, cost-effective, and environmentally sustainable Kubernetes environment.
In this post, we’ll go a step further by providing actionable information on how to reduce your Kubernetes-related costs. We’ll break down what drives these costs, who is responsible for them, and how you can effectively measure and optimize your resource usage. Let’s dive in.
What drives Kubernetes costs?
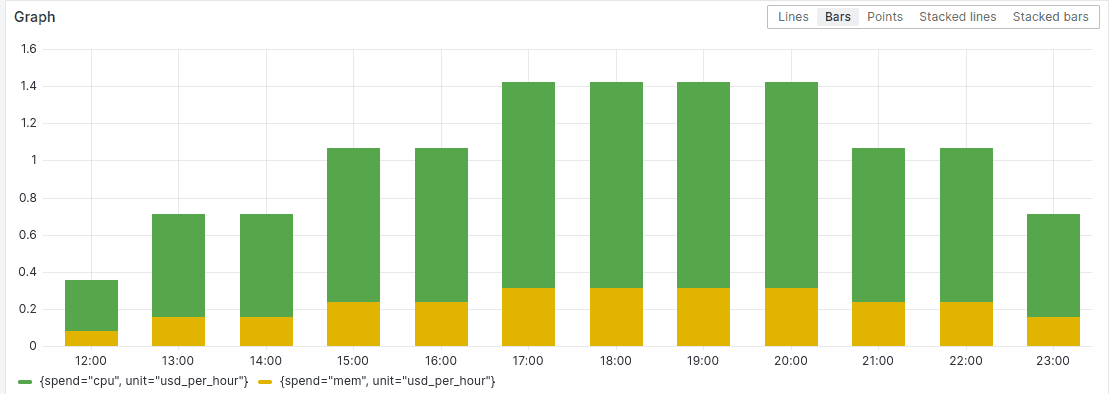
At its core, the cost associated with running a Kubernetes environment can be summarized with the formula:
Spend = usage × rate
Here, usage refers to the amount of resources consumed that are either unused or underused. Rate is the cost per unit of these resources. To manage and reduce costs, you need to focus on both components—reducing unnecessary usage and optimizing the rates you pay for the resources you actually use.
For a deeper discussion on this formula, check out this KubeCon 2023 talk by my colleagues Mark Poko and JuanJo Ciarlante.
Next, let’s break down the resources, actions, and users that drive those costs.
Resources
- Compute resources: CPU and memory are primary cost drivers. The more you use, the higher your bill.
- Storage: Persistent volumes and disk I/O also contribute significantly to costs.
- Networking: Data transfer costs can add up, especially for applications with high bandwidth requirements.
- Managed services: If you are using managed Kubernetes services like GKE (Google Kubernetes Engine) or EKS (Amazon Elastic Kubernetes Service), the service fees will be part of your cost structure.
Actions
- Over-provisioning: Allocating more resources than necessary typically leads to unnecessary spending.
- Letting resources sit idle: Inactive nodes or persistent volumes can still incur costs.
- Not setting request limits: Applications can rack up unnecessary costs without appropriate consumption guardrails.
- Unchecked scaling: Constantly scaling clusters up without properly scaling them down can lead to inefficiencies.
- Storage mismanagement: Mismanaging storage resources can lead to high costs, especially if you use high-performance storage when you don’t need to.
Users
- DevOps engineers: Responsible for managing the Kubernetes clusters, configuring nodes, and setting up auto scaling.
- Developers: Write the applications that run on the Kubernetes clusters. Their code and resource requests directly impact usage.
- Cloud architects: Design the overall cloud infrastructure and strategies for resource utilization.
- Finance teams: While these individuals don’t affect how large your bill is, they do monitor and manage cloud spending, often pushing for cost optimization strategies.
Lessons Learned: top cost-saving tips from Grafana Labs
Now that we’ve covered what drives Kubernetes costs, let’s look at how you can bring those bills down. Optimization involves continuous learning and improvement, and after years of managing Kubernetes at scale internally, we’ve learned a thing or two.
Our platform team runs a highly reliable and efficient deployment on Grafana Cloud, our SaaS platform, for customers across the globe. Here are our top three takeaways about operating Kubernetes clusters efficiently.
1. Regularly monitor and adjust. Use tools like Prometheus and Grafana to keep a close eye on resource utilization. Regularly review and adjust resource requests and limits based on observed usage patterns.
2. Leverage auto scaling. Implement auto scaling tools such as Horizontal Pod Autoscaler (HPA) and Cluster Autoscaler. They help ensure that your cluster scales up and down based on actual demand, preventing over-provisioning and under-utilization.
3. Optimize resource allocation. Remove unnecessary processes, fine-tune application performance, and ensure that resource requests and limits are set appropriately. This step helps in making efficient use of available resources and reduces costs.
Monitor usage in order to know where to cut
If you want to properly implement any of these strategies, you need to accurately measure usage so you can adjust accordingly. Here are some of the dimensions to observe to help reduce Kubernetes costs.
Nodes
- CPU utilization: Ensure nodes are not consistently over- or under-utilized.
- Memory utilization: Monitor memory usage to prevent out-of-memory errors and unnecessary costs.
- Disk I/O: High disk operations can indicate bottlenecks or inefficient storage usage.
Workloads
- Application performance metrics: Use tools like Prometheus to gather detailed metrics on application performance.
- Resource requests and limits: Ensure that pods have appropriate resource requests and limits set.
Idle resources
- Underutilized nodes: Nodes that consistently show low utilization should be consolidated or scaled down.
- Underutilized nodes: Nodes that consistently show low utilization should be consolidated or scaled down.
- Persistent volumes: Check for unused or underutilized persistent volumes.
Tuning the scheduler
If you’re using AWS or Google Cloud, optimizing the Kubernetes scheduler can help in better resource utilization:
OPTIMIZE_UTILIZATIONin GKE: GKE offers configurations to optimize resource utilization. Tuning these settings can help reduce costs.
Implement Grafana for monitoring
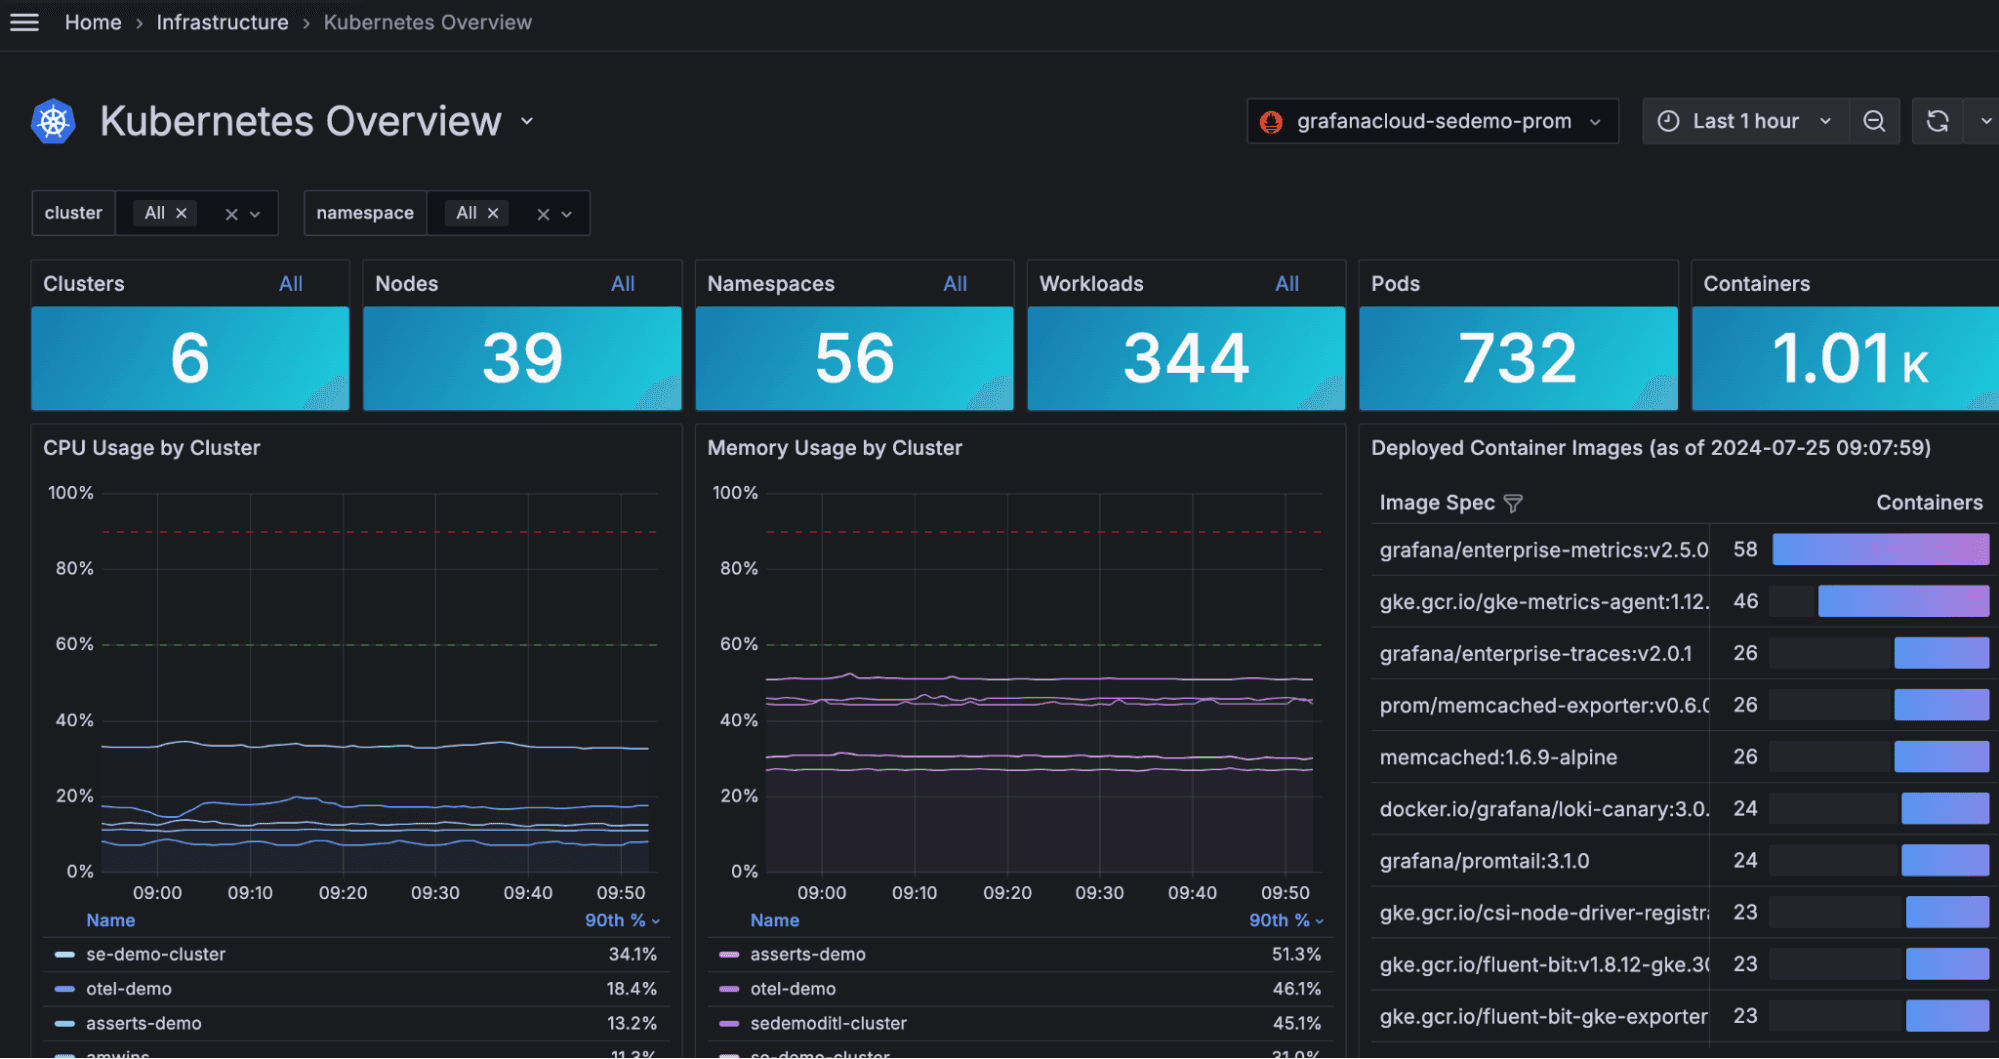
Grafana is a powerful tool for monitoring and visualizing Kubernetes metrics. It integrates well with Prometheus and other data sources, providing a comprehensive view of your cluster’s performance and resource usage.
- Set up dashboards: Create dashboards to monitor CPU, memory, disk I/O, and network usage.
- Leverage OpenCost: Gain detailed insights into resource usage and costs, enabling more efficient and cost-effective management of your infrastructure.
- Alerting: Configure alerts for key metrics to proactively manage resource usage and prevent cost overruns.
- Use Kubernetes Monitoring: The Kubernetes Monitoring application provides a managed solution for resource utilization visualizations, metrics, and alerts.

With a little bit of practice and the right tools, any team can create actionable strategies for reducing Kubernetes-related costs. And don’t forget, all of the tools you need to monitor and optimize their resource utilization are available in Grafana Cloud’s turnkey Kubernetes Monitoring application. This is the easy path to gain insights quickly, and it’s available on all tiers of Grafana Cloud, including our forever-free tier.
Grafana Cloud is the easiest way to get started with metrics, logs, traces, dashboards, and more. We have a generous forever-free tier and plans for every use case.Sign up for free now!

