
How to instrument your Python application using OpenTelemetry
If you want to see if OpenTelemetry helps you become a better Python developer — or if you just want to know how to add OpenTelemetry to your Python service — you’ve come to the right place.
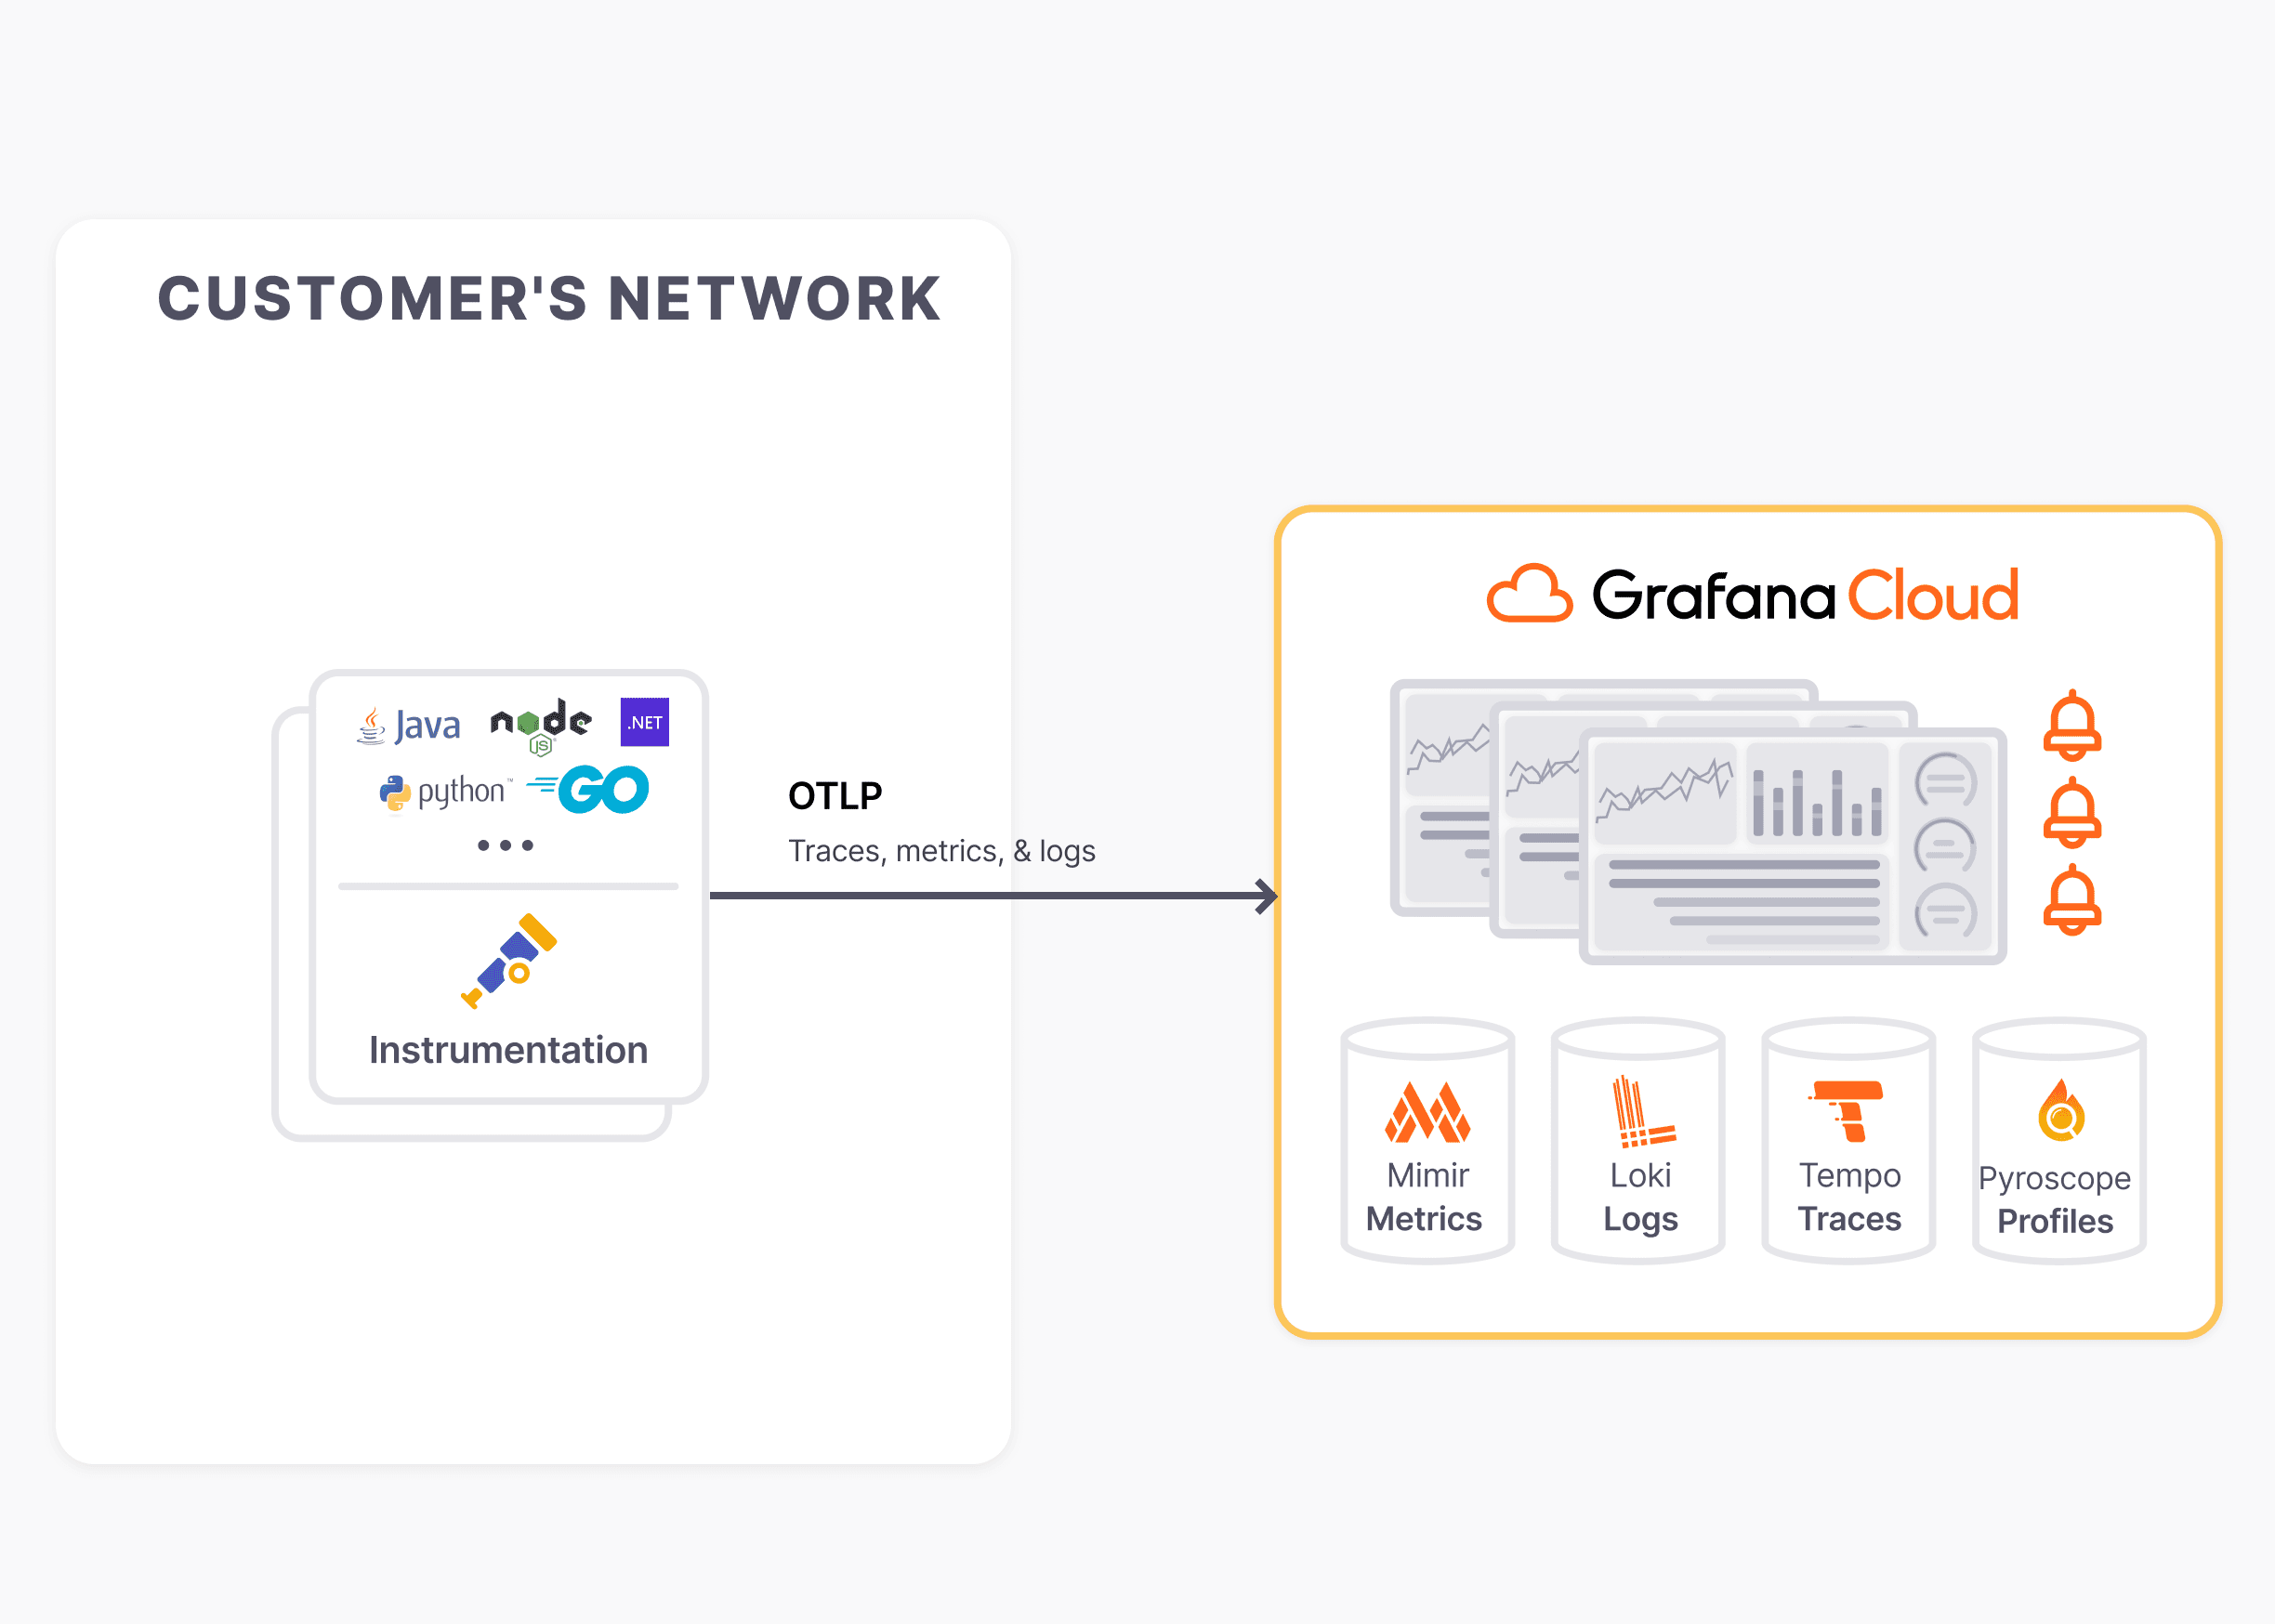
In this blog, we’ll show you how to instrument your Python application using OpenTelemetry and how to visualize your OpenTelemetry data using Application Observability in Grafana Cloud. We’ll walk you through the following steps:
- Create a Python application
- Install the Python instrumentation library
- Configure a Python application
- Run the Python application
- Observe the service in Application Observability in Grafana Cloud

Note: This guide is intended for local development or evaluation setups and sends data directly to Grafana Cloud without an OpenTelemetry Collector or Grafana Agent. A production guide can be found here.
You can also send data to Grafana Cloud or a self-hosted Grafana LGTM Stack (check out this guide) and build your own dashboards with Grafana.
Because OpenTelemetry is vendor-neutral, you can also follow the steps in this blog post for any vendor backend that accepts OpenTelemetry data using the OTLP protocol — just ignore parts that are marked Grafana-specific.
1. Create a Python application
If you already have a Python application (e.g. Flask or Django), you can skip this step.
Note: You can also find this application on GitHub.
If any of the steps below are failing, this blog post is probably outdated, and the GitHub repository is up-to-date.
To begin, set up an environment in a new directory:
mkdir otel-getting-started
cd otel-getting-started
python3 -m venv venv
source ./venv/bin/activate
Now install Flask (werkzeug must be smaller than 3, otherwise nothing will happen):
pip install 'flask<3' 'werkzeug<3'
Create a file app.py and add the following code to it:
from random import randint
from flask import Flask, request
import logging

app = Flask(__name__)
logging.basicConfig(level=logging.INFO)
logger = logging.getLogger(__name__)

@app.route("/rolldice")
def roll_dice():
    player = request.args.get('player', default = None, type = str)
    result = str(roll())
    if player:
        logger.warn("%s is rolling the dice: %s", player, result)
    else:
        logger.warn("Anonymous player is rolling the dice: %s", result)
    return result

def roll():
    return randint(1, 6)
Run the application with the following command and open http://localhost:8080/rolldice in your web browser to ensure it is working.
flask run -p 8080
2. Install the Python instrumentation library
First, install the latest release of the OpenTelemetry Python package:
pip install 'opentelemetry-distro[otlp]'
opentelemetry-bootstrap -a install
Supported libraries
A number of popular Python libraries are auto-instrumented, including Flask and Django. You can find the full list here.
gunicorn
If you use a web server that spawns multiple processes to serve requests in parallel, follow the gunicorn guide to avoid Global Interpreter Lock. Other web servers, such as uWSGI, require a similar setup.
3. Configure the Python application
Next, customize the following shell script to instrument an application and send data to a vendor or open source backend.
export OTEL_SERVICE_NAME=
export OTEL_PYTHON_LOGGING_AUTO_INSTRUMENTATION_ENABLED=true
opentelemetry-instrument flask run -p 8080
In this example, we will be sending our data to Grafana Cloud. Follow these steps to get necessary information for the shell script:
- Sign in to Grafana Cloud. (If you don’t have an account, create a free Grafana Cloud today!) The browser will navigate to the Grafana Cloud Portal page.
- If the account has access to multiple Grafana Cloud organizations, select an organization from the top left organization dropdown.
- If the organization has access to multiple Grafana Cloud stacks, navigate to a stack from the left sidebar or the main Stacks list.
- Once you have a stack selected, or in the single stack scenario, click Configure in the OpenTelemetry section:

- In the Password / API Token section, click on Generate now to create a new API token:
- Give the API token a name, for example cart-service
- Click on Create token
- Click on Close without copying the token
- Click on Copy to Clipboard to copy the environment variables to the clipboard

- Pick a Service Name to identify the service, for example
cart - Replace
flask run -p 8080with the start command that runs the application to instrument (Flask is just an example. It can also be Django, etc.)
Considerations
Logging
Logs have to be enabled explicitly with OTEL_PYTHON_LOGGING_AUTO_INSTRUMENTATION_ENABLED=true because it is still experimental.
Performance issues
Tracing can create a significant overhead in Python applications. Please adjust the sampling rate if you experience performance issues.
Not using Grafana Cloud?
If you want to use a different backend, consult your vendor for the right values for OTEL_EXPORTER_OTLP_PROTOCOL, OTEL_EXPORTER_OTLP_ENDPOINT and OTEL_EXPORTER_OTLP_HEADERS.
Observing the application in a UI will also be different, but the application itself does not change.
4. Run the Python application
Finally, run the Python application with the shell script from the previous step and make some requests to the service to send data to Grafana Cloud.
5. Observe the service in Application Observability in Grafana Cloud
Open Application Observability in Grafana Cloud:
- Navigate to a stack
https://<your-stack-name.>grafana.net - Expand the top left menu below the Grafana logo
- Click on Application
Activate metrics generation
Application Observability relies on metrics generated from traces already sent to Grafana Cloud Traces.
Metrics generation is self-serve and can be enabled during onboarding and disabled from Application Observability configuration.
To complete the setup, click Activate Application Observability to enable metrics generation.
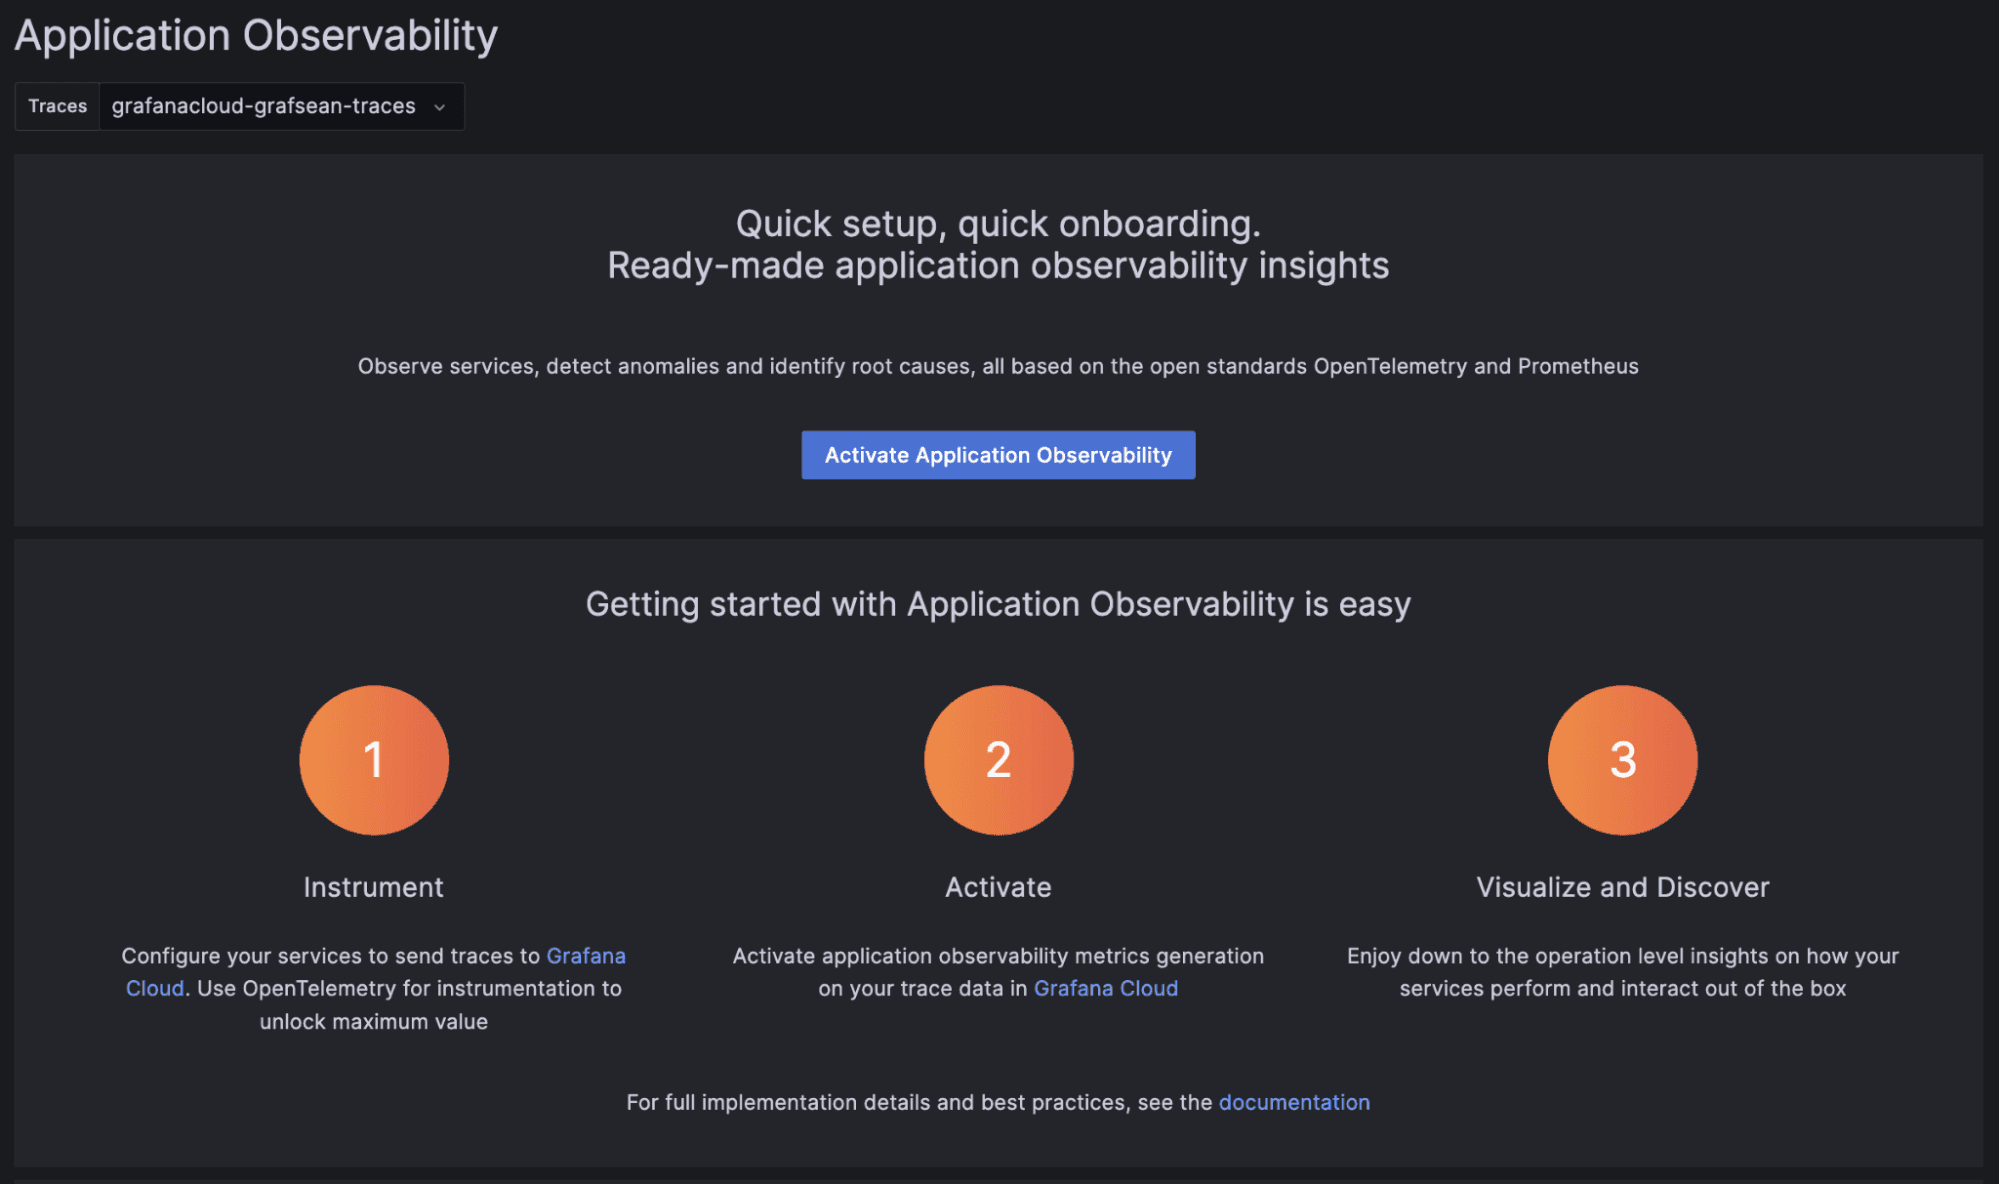
Note: It might take up to five minutes to generate metrics and show graphs.
Learn more about Application Observability in Grafana Cloud
Grafana Cloud Application Observability is an out-of-the box solution to monitor applications and minimize MTTR (mean time to resolution). Application Observability is our take at combining the best observability technologies into a seamless package:
- OpenTelemetry for getting the best data out of your application — without vendor lock-in
- Prometheus and Grafana Cloud as proven technologies for storing and visualizing telemetry data with rich integrations (e.g. frontend and infrastructure monitoring)
Discover more about Application Observability in our documentation:
- Service Inventory: filter, and search services and view RED metrics.
- Service Overview: traces, logs, RED metrics, operations, and runtime information.
- Service Map: graph of connected services, service dependencies, and data flow.
Grafana Cloud is the easiest way to get started with metrics, logs, traces, dashboards, and more. We have a generous forever-free tier and plans for every use case. Sign up for free now!

