
Protect PII and add geolocation data: Monitoring legacy systems with Grafana
Legacy systems often present a challenge when you try to integrate them with modern monitoring tools, especially when they generate log files that contain personally identifiable information (PII) and IP addresses.
Thankfully, Grafana Cloud, which is built to work with modern observability tools and data sources, makes it easy to monitor your legacy environments too. To illustrate this, we’ll show you how to use Grafana to monitor legacy email service QMailToaster in a way that protects user privacy and adds geolocation data to the logs. We’ll even show you how to take it a step further by integrating Grafana Cloud Synthetic Monitoring to provide valuable SLO/SLI indicators for SREs.
And while the steps laid out in this post focus on this one specific legacy service, these same techniques for ingesting and parsing data can be applied to any system that generates log files containing PII and IP addresses. Ultimately, this will help you save time, protect user privacy, and gain valuable insights into your legacy systems.
Why you need to obfuscate PII in logs from legacy systems
In today’s digital landscape, protecting user privacy is paramount. Regulations like GDPR and CCPA impose strict rules on how organizations collect, store, and process user data. As a result, organizations must implement security measures to ensure the confidentiality, integrity, and availability of user data. In the context of legacy systems and modern monitoring tools, compliance with these regulations can pose significant challenges.
Legacy systems like QMailToaster generate log files that often contain PII and IP addresses. For example, QMailToaster includes Vpopmail, Spamd, Simscan, and Dovecot — each of which generates logs related to authentication, user management, spam detection, email scanning, and email delivery.
Unlike modern systems, legacy systems often don’t automatically obfuscate PII data. As a result, it becomes even more crucial to make sure PII data is obfuscated before it’s sent to tools like Grafana Cloud.
In addition to better data privacy, obfuscating PII and adding geolocation data also enable better analysis of the data collected. By resolving IP addresses into geographic information, users can easily understand where their users are located and what regions they are interacting with. This provides valuable insights for businesses that operate globally or want to understand the geographic distribution of their users.
How to integrate QMailToaster with Grafana Cloud
In the following sections, we’ll walk through how to ingest legacy system logs into Grafana Cloud using Grafana Agent. We’ll also create a dashboard that shows the overall health and status of these services by parsing the logs and adding additional labels for geolocation such as information about continent, country, city, and more.
Before we get started, let’s take a quick look at each service and the logs they generate:
- Vpopmail: A POP3/IMAP server that stores user accounts. It generates logs related to authentication and user management.
- Spamd: A spam filter that uses various techniques to identify spam emails. It generates logs related to spam detection.
- Simscan: A content filter that scans emails for viruses, spam, and other types of malicious content. It generates logs related to email scanning.
- Dovecot: A POP3/IMAP server that provides access to email accounts. It generates logs related to authentication and email delivery.
Now let’s dive into how to ingest and parse these logs.
Ingesting QMailToaster logs
To ingest the logs from QMailToaster, we will use Promtail, a log collector and processor that works with Grafana Cloud Logs. It’s also packaged as part of Grafana Agent. Promtail can scrape logs from various sources, apply filters, and send the filtered logs to Grafana Loki, which is Grafana’s open source log aggregation system that powers Grafana Cloud Logs. Grafana Cloud Logs then uses a stream processing architecture that stores log data as a series of streams, which can be quickly queried and filtered in real time.
The logs are stored in plain text format, and each log entry is a single line. The log entries follow a specific format, which varies between the components. For example, a sample log entry from the SMTP daemon log file may look like this:
Feb 22 09:00:03 mx vpopmail[1491701]: vchkpw-smtp: vpopmail user not found john@example.com@:192.168.1.1
This log entry contains information about a user’s login, including their email address, the IP address from which they tried to log in, and the protocol. To ingest this log entry we use Promtail, which is part of Grafana Agent.
Obfuscating personal information
Log files can contain PII like IP addresses, email addresses, and hostnames, which may not be suitable for sharing with others and may also breach regulatory frameworks such as GDPR. To avoid exposing this information, we can obfuscate or redact it before sending the logs to a central monitoring system.
Promtail includes a feature called pipeline stages, which can be used to obfuscate sensitive information in log lines. We can use this feature to replace sensitive information like IP addresses and email addresses with a fixed string or a hash value.
Here is an example of how to obfuscate IP4 addresses and email addresses using Promtail.
pipeline stages:
  pipeline_stages:
    - replace:
        expression: '(\d{1,3}[.]\d{1,3}[.]\d{1,3}[.]\d{1,3})'
        replace: '*IP4*{{ .Value | Hash "salt" }}*'
    - replace:
        expression: '([\w\.=-]+@[\w\.-]+\.[\w]{2,64})'
        replace: '*email*{{ .Value | Hash "salt" }}*'
(Note: We intend to release the GeoLocation functionality as part of the next Promtail release.)
Promtail will soon include a feature that can be used to resolve IP addresses into geographic information like city, country, and ASN details. This feature will use the Maxmind GeoIP2 databases, which can be downloaded from the Maxmind website by registering for a free account.
To use this feature, you will need to download the GeoIP2 database and place it in a directory accessible to Promtail. You will also need to configure the regex parser to extract the IP address from the log entry and add a label to the log entry with the IP address. Finally, you will need to configure the GeoIP pipeline stage to use the label containing the IP address to perform the GeoIP lookup.
The following configuration shows an example of how to configure Promtail to use the GeoIP location feature:
scrape_configs:
- job_name: maillog
  pipeline_stages:
    - regex:
        expression: '(?P\d{1,3}\.\d{1,3}\.\d{1,3}\.\d{1,3})'
    - geoip:
        db: "/mnt/config/GeoLite2-City.mmdb"
        source: "ip"
        db_type: "city"
  static_configs:
  - targets:
      - localhost
    labels:
      geoip_country_name:
      job: maillog
      __path__: /var/log/maillog
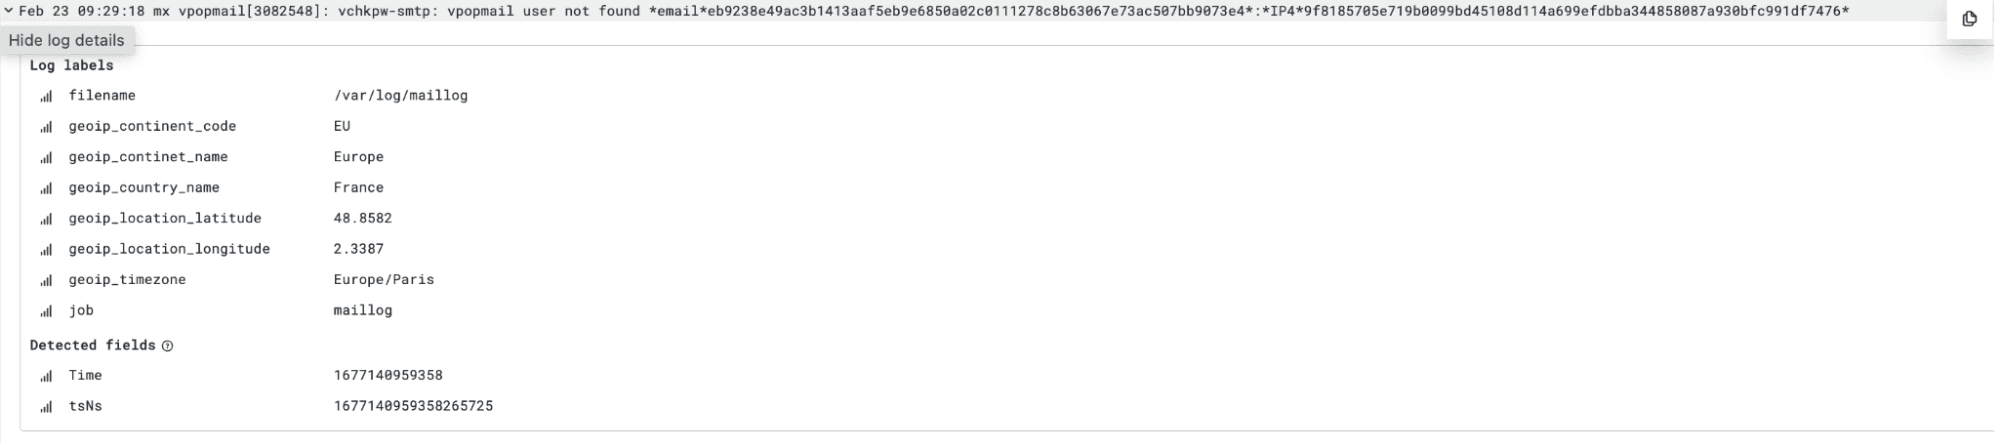
In this configuration, we define a “scrape_config” for the mail log file. We use the regex parser to extract the IP address in the log entry and add a label called “ip” to the log entry with the IP address. We then use the “geoip” pipeline stage to perform a GeoIP lookup on the ip label and add labels with the location information to the log entry. By performing this “pipeline_stage,” additional labels are added to Loki. For example, an IP address belonging to a service provider in Vienna might look like this:
Building out the map panel
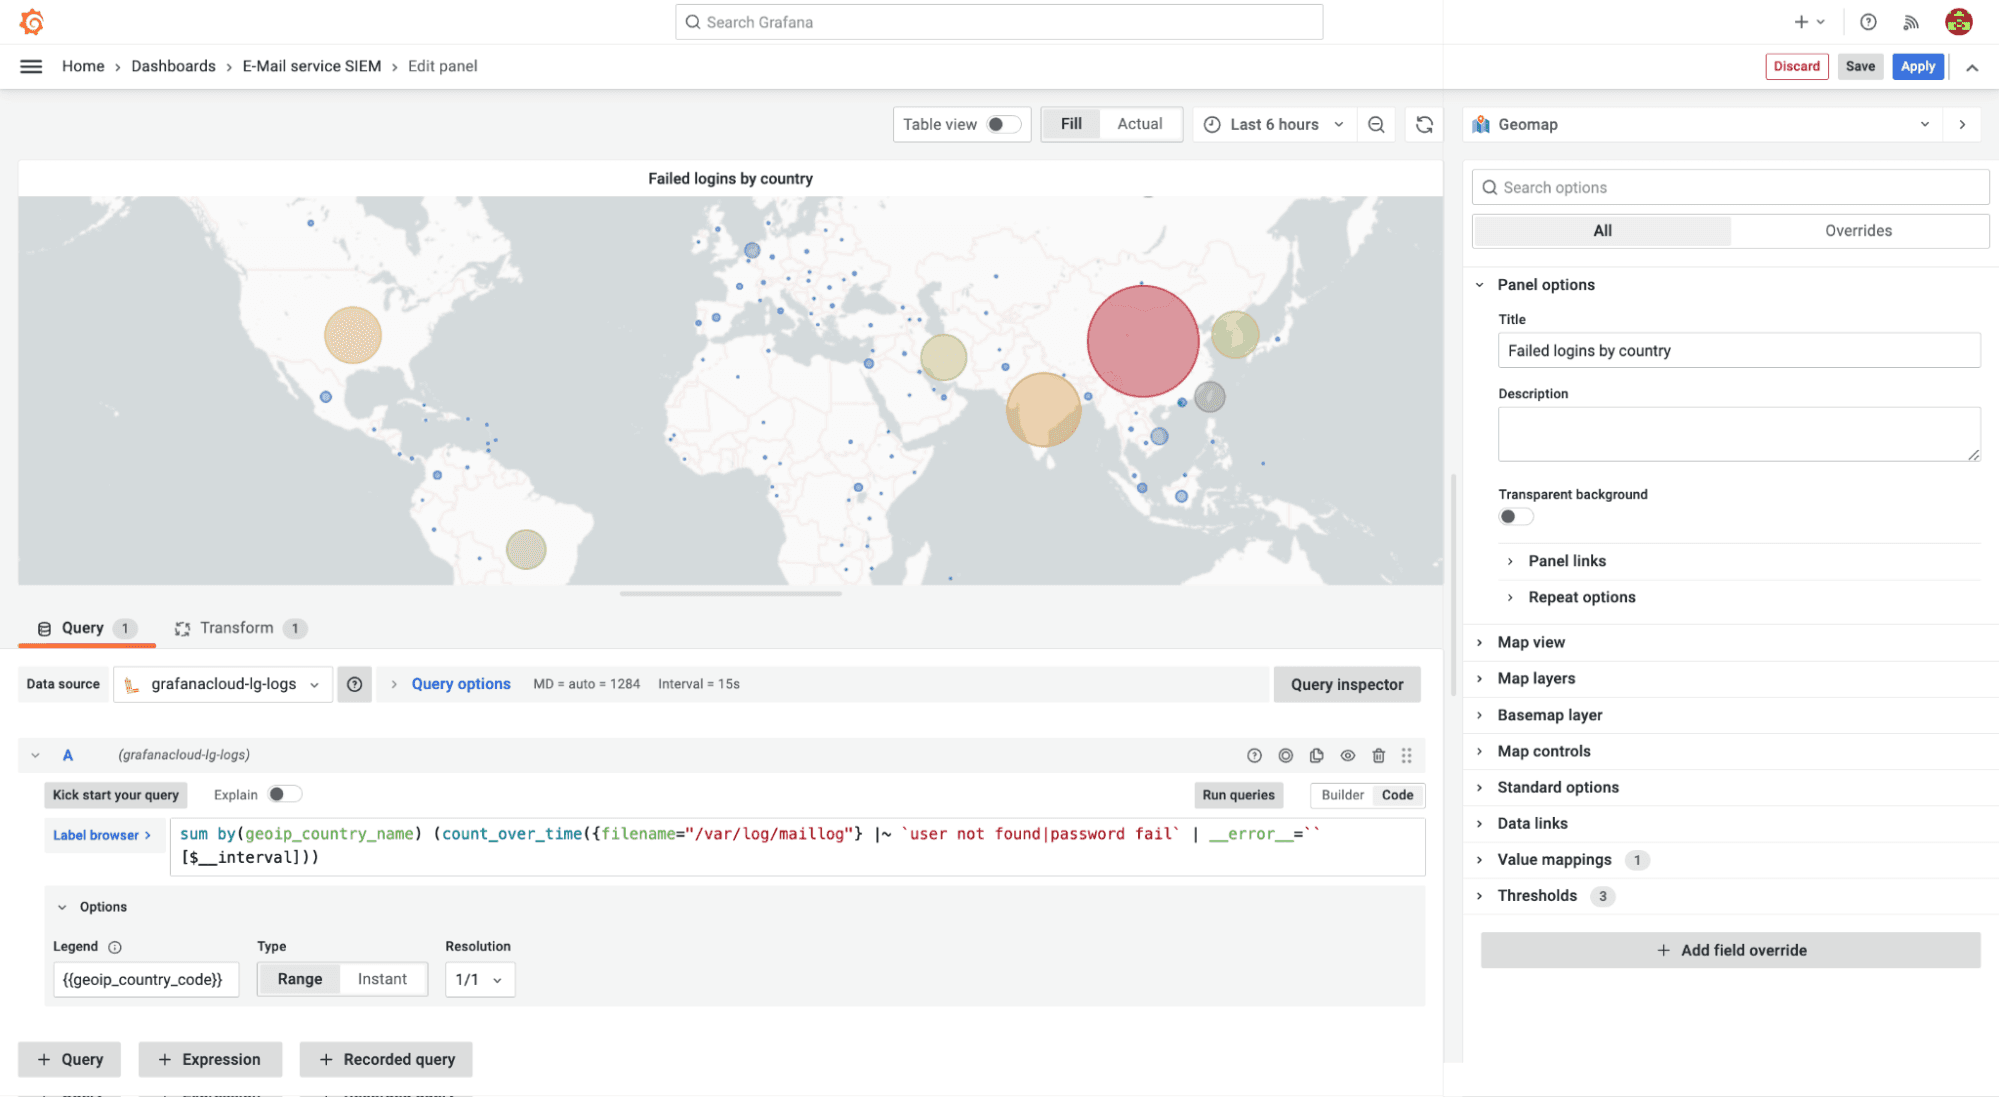
By using the labels added by the “geoip” pipeline stage we can write a LogQL query that will count the number of attempts over time and summarize by country. By using this together with the geomap plugin we can use the values to overlay heatmaps and visualize which country the most malicious attempts originates from.
sum by(geoip_country_name) (count_over_time({filename="/var/log/maillog"} |~ `user not found|password fail` | __error__=`` [$__interval]))
And that’s it. After just a few quick steps, you’ll be able to monitor your legacy system and get better user insights, all while ensuring users’ data remains secure and your company remains compliant.
The next step: the ‘finished’ product
Email is a crucial communication tool for businesses and individuals alike, and it’s essential that it functions reliably and securely. With that in mind, I wanted to quickly show you what else you can do with Grafana Cloud to better monitor your legacy systems.
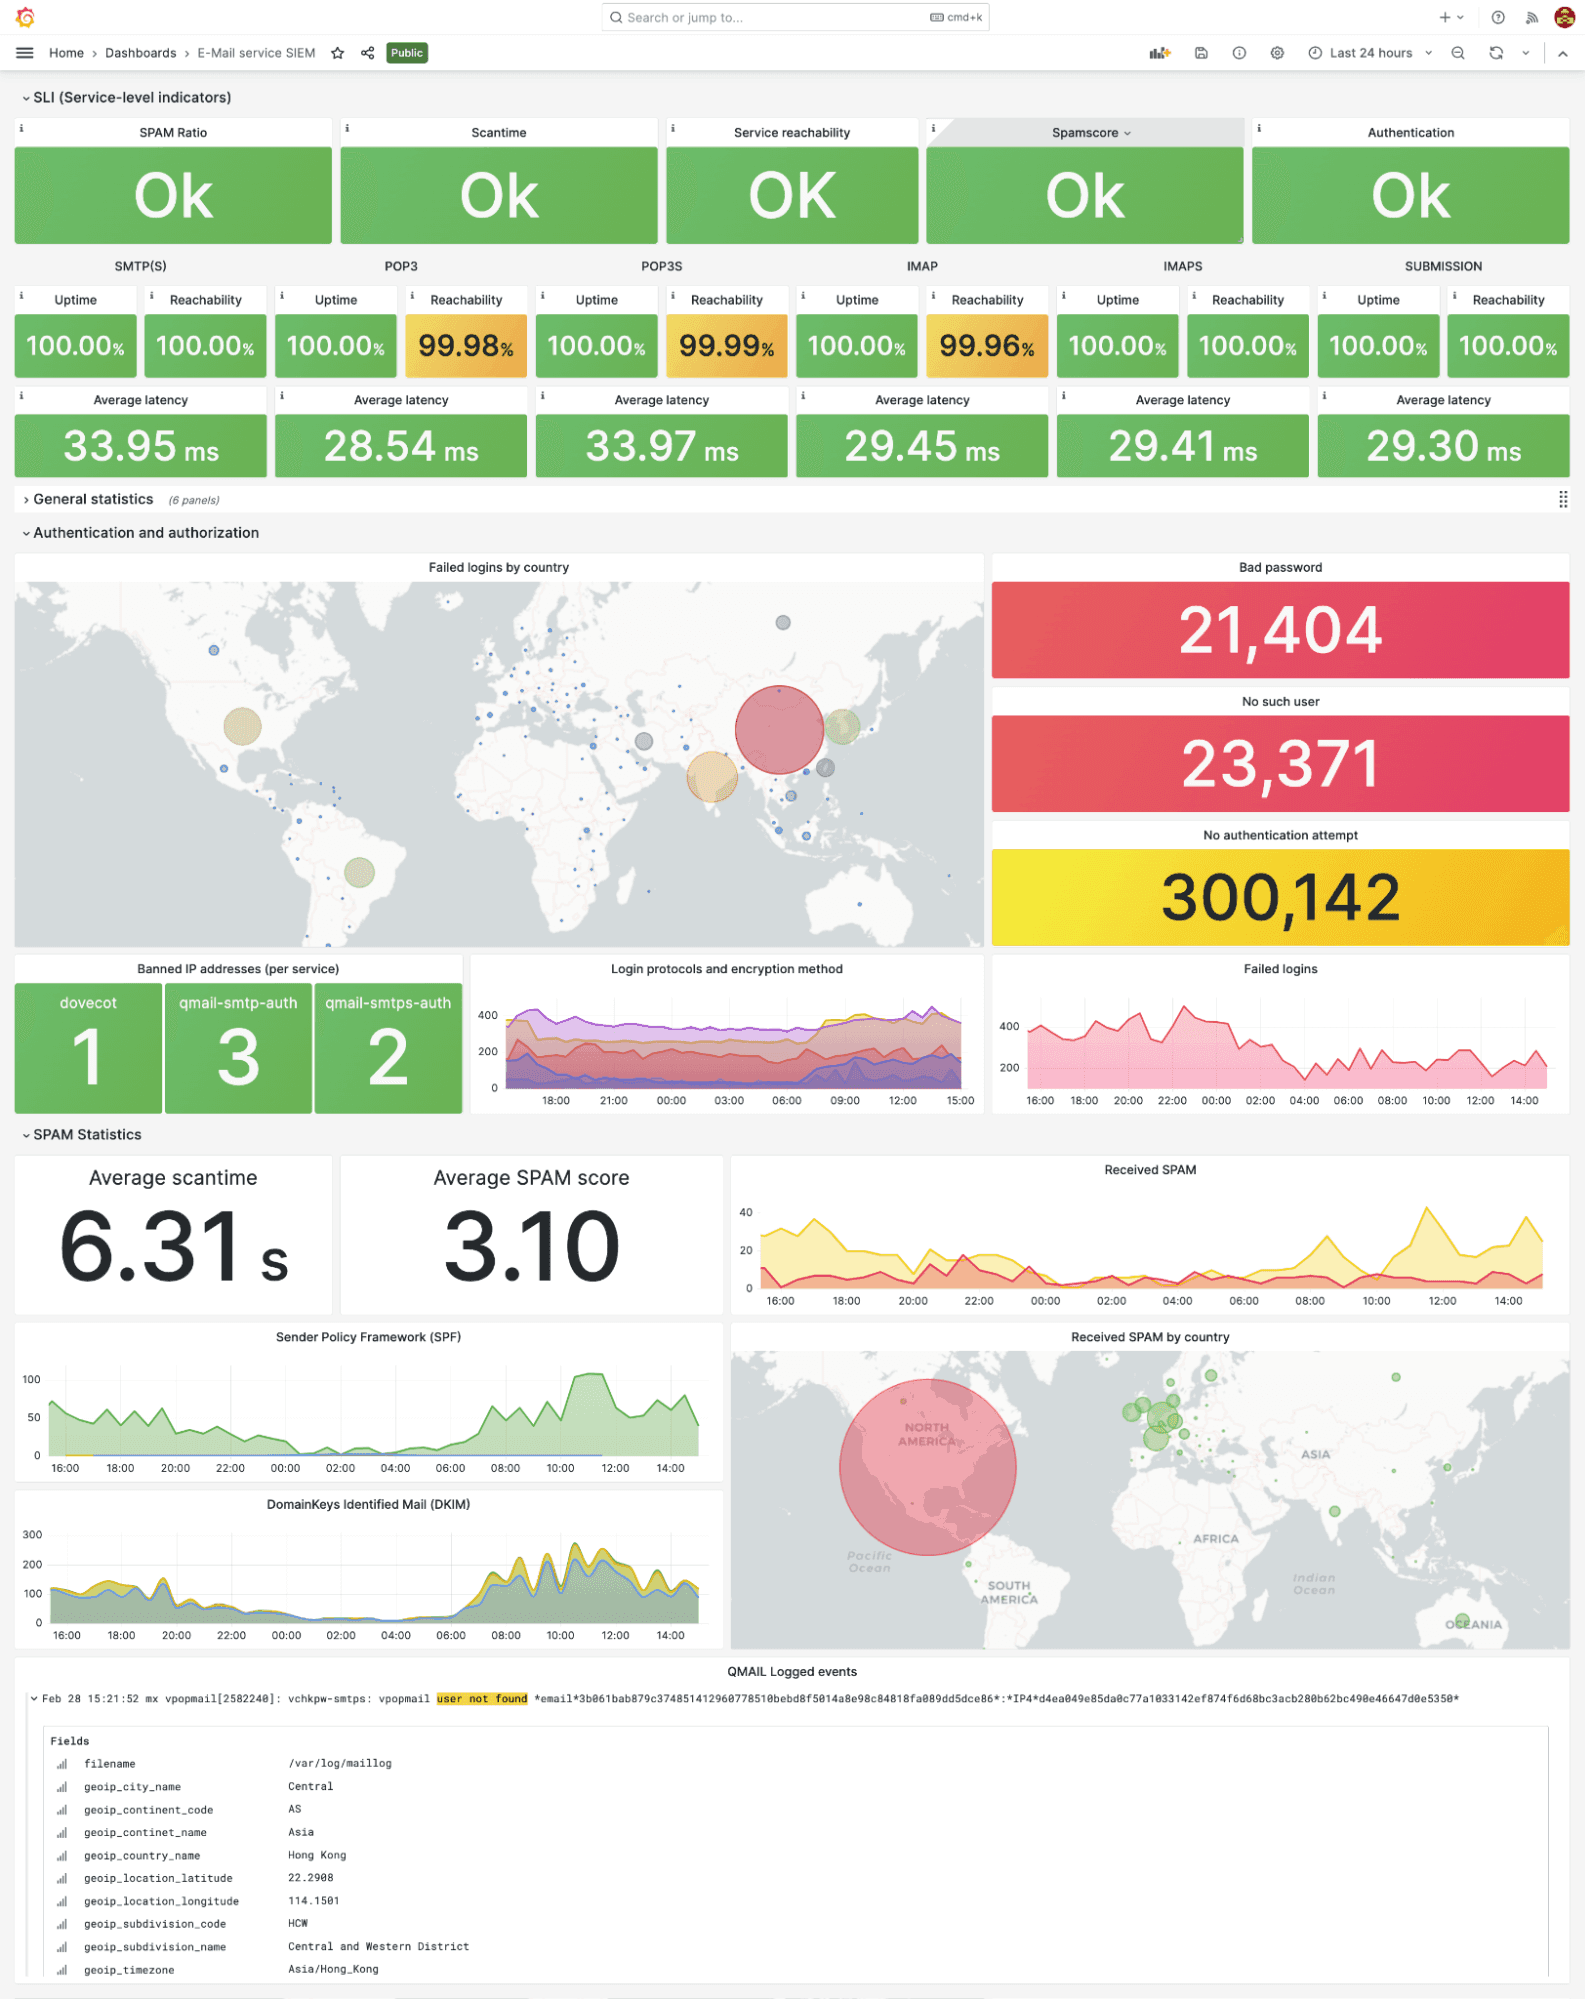
As part of my ongoing efforts to monitor the health and performance of our hypothetical email service, I decided to incorporate Grafana Cloud Synthetic Monitoring to create SLO/SLI indicators and enhance the dashboard’s utility for SREs.
The new dashboard provides an overall view of the email service’s health, highlighting any issues or potential problems with SMTP, SMTPS, POP3, POP3S, IMAP, IMAPS, and submission. By leveraging Grafana Cloud synthetic probes around the world, we’re able to monitor uptime and latency and quickly identify any potential issues before they escalate into full-blown outages.
But it’s not just about identifying issues; we also wanted to gain insight into the root cause of any problems we encounter. By utilizing Synthetic Monitoring, we can determine the source of malicious login attempts and spam, helping us to take proactive steps to prevent them from occurring in the future.
Overall, the SLO/SLI indicators provided by Grafana Cloud Synthetic Monitoring have been invaluable in improving the reliability and security of our email service. With a comprehensive view of the service’s health and performance, we can take action quickly and effectively to maintain our high standards and keep our users happy.
Grafana Cloud is the easiest way to get started with metrics, logs, traces, and dashboards. We have a generous free forever tier and plans for every use case. Sign up for free now!

