Cost attribution in Grafana Cloud: Manage spend across observability and testing workflows Grafana CloudCost managementSynthetic monitoringPerformance Testing
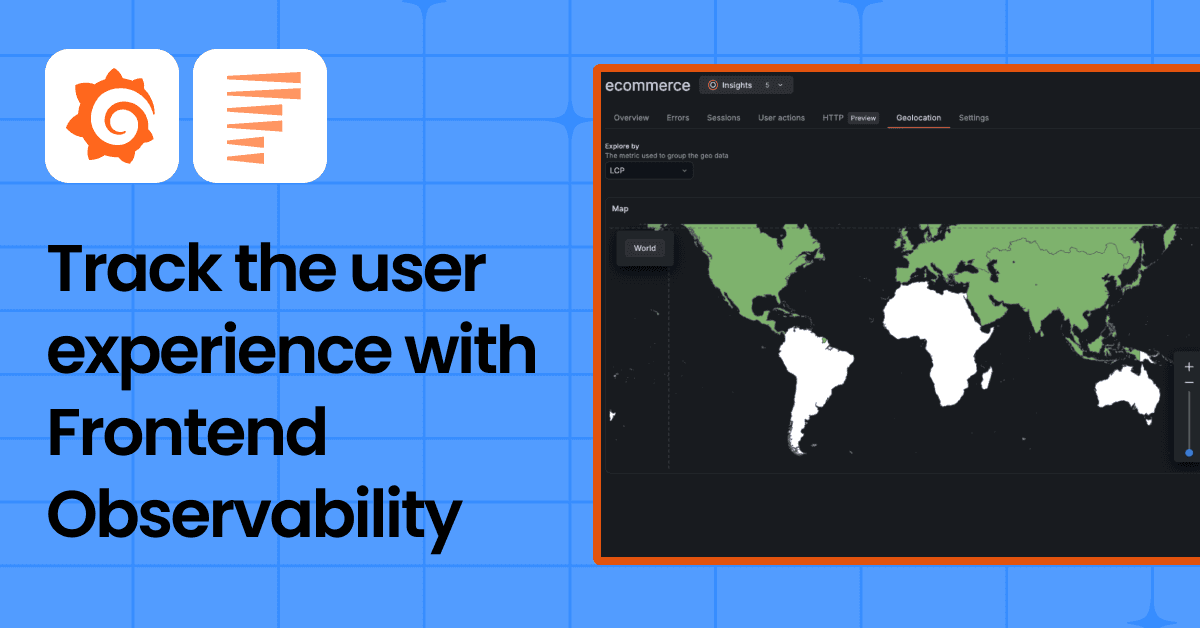
Beyond performance monitoring: Understand the user experience with Grafana Cloud Frontend ObservabilityGrafana Cloud Frontend Observability
Grafana Labs named a Leader again in the 2026 Gartner® Magic Quadrant™ for Observability PlatformsObservabilityGrafana Cloud
Stop switching tools to find answers: Grafana Assistant now works across 30+ data sourcesAIGrafanaIntegrations
Building an end-to-end reliability testing strategy with Grafana CloudPerformance TestingGrafana CloudSynthetic monitoringFrontend observabilityGrafana Cloud k6
'Grafana's Big Tent' podcast: Anthropic on agentic coding, observability, and the future of software engineeringPodcastsAIObservability
Full-stack observability in Grafana Cloud: How to investigate issues across services and infrastructure Grafana CloudDrilldown
Grafana 13.1 release: observability as code updates, extending Grafana Assistant across more data sources, and moreGrafanaRelease
Post-incident review for TanStack npm supply chain ransom incident: No unauthorized access to customer production systemsSecurity
How to generate real-world load tests using Grafana Cloud k6 and production telemetryGrafana Cloud k6Grafana CloudLoad testingPerformance Testing
Tempo 3.0 release: a new architecture for scale and lower TCO, TraceQL metrics GA, and moreTempoTracing
Spend less time on repetitive tasks with the new automation feature in Grafana AssistantAIGrafana Cloud
Cost attribution in Grafana Cloud: Manage spend across observability and testing workflows Grafana CloudCost managementSynthetic monitoringPerformance Testing
Grafana Labs named a Leader again in the 2026 Gartner® Magic Quadrant™ for Observability PlatformsGrafana Labs has been recognized as a Leader in the 2026 Gartner® Magic Quadrant™ for Observability Platforms for the third consecutive year.ObservabilityGrafana Cloud
Grafana 13.1 release: observability as code updates, extending Grafana Assistant across more data sources, and moreGrafanaRelease
Stop switching tools to find answers: Grafana Assistant now works across 30+ data sourcesAIGrafanaIntegrations
'Grafana's Big Tent' podcast: Anthropic on agentic coding, observability, and the future of software engineeringPodcastsAIObservability