

How to collect Prometheus metrics with the OpenTelemetry Collector and Grafana
OpenTelemetry is a set of APIs, SDKs, tooling, and integrations that are designed for the creation and management of telemetry data such as traces, metrics, and logs.
One of the main components of OpenTelemetry, or OTel for short, is the OpenTelemetry Collector. The OpenTelemetry Collector, or Otel Collector, is a vendor-agnostic proxy that can receive, process, and export telemetry data. It supports receiving telemetry data in multiple formats (e.g., OTLP, Jaeger, Prometheus, as well as many commercial/proprietary tools) and sending data to one or more backends.
The collector is a powerful way to receive data from multiple sources, transform it, and send it to the destinations you like. Here, we will look into how we can scrape Prometheus metrics with the OpenTelemetry Collector and send them to a remote write destination like Grafana Cloud.
How to set up OpenTelemetry in Grafana Cloud
Set up exporters / applications
To collect metrics, applications should expose their metrics in Prometheus or OpenMetrics format over http. For applications that cannot do that, there are exporters that expose metrics in the right format.
In our example, I will be setting up Node Exporter on an Ubuntu Server. You could also download the binary and set it up in the linked guide.
$ apt install prometheus-node-exporter
This should now run the node-exporter which exposes the Linux node metrics on http://localhost:9100/metrics.
You can look at the metrics being exposed by running:
$ curl localhost:9100/metrics
Create a Grafana Cloud account
You also need a remote endpoint to send and view your metrics, and one of the easiest ways to store Prometheus metrics is to use Grafana Cloud. You can skip this step if you already have a remote endpoint and credentials.
If you don’t have an account, you can easily sign up for a free Grafana Cloud account. Once you create your account, you’ll be dropped into a Grafana instance that will help you get started with sending metrics.
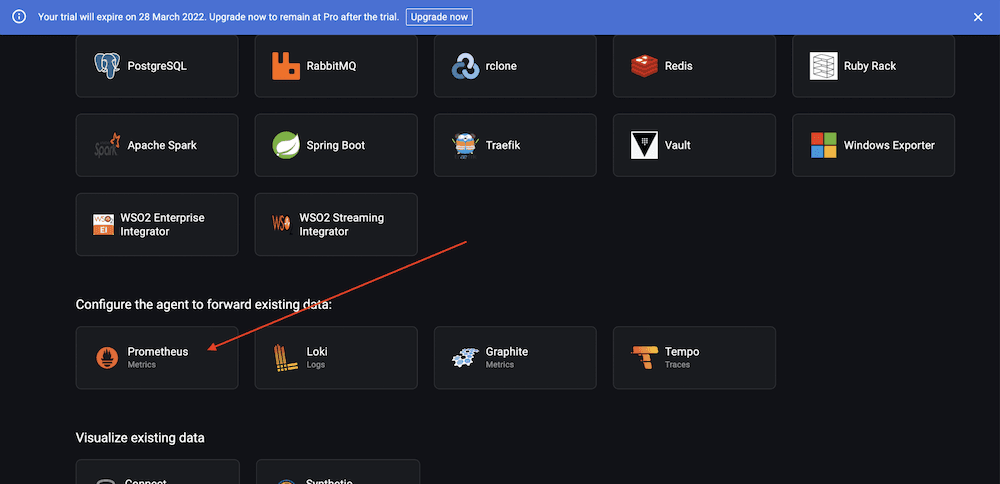
Scroll down and select the Prometheus option:
In the configuration options, select From my local Prometheus server > then Send metrics from a single Prometheus instance > enter name for the API Key, as shown:
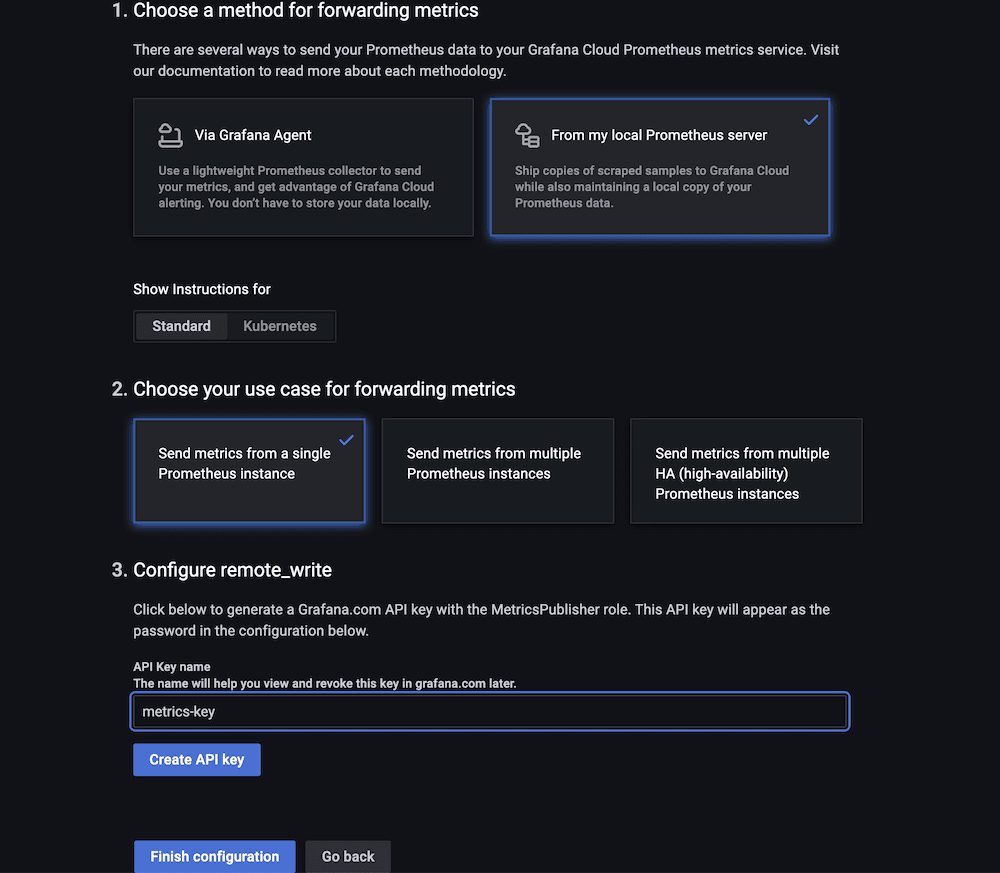
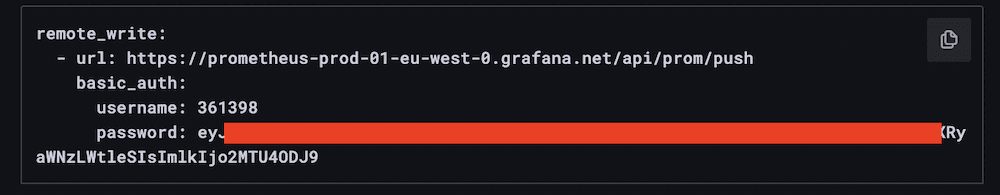
Hit Create API Key. This should give you the configuration. Please copy it and keep it safe.
Now, while we are using the OpenTelemetry Collector, it acts as a single Prometheus server and has the same configuration, which is why we picked the above options.
How to configure the OpenTelemetry Collector
Now that we have something to collect metrics from and somewhere to send them to, let’s go ahead and setup the OTel Collector.
You can download the binaries or distributions for most architectures / OS with the following link: https://github.com/open-telemetry/opentelemetry-collector-releases/releases/tag/v0.48.0
In this guide, I am using Ubuntu as an example:
$ wget
  https://github.com/open-telemetry/opentelemetry-collector-releases/releases/download/v0.46.0/otelcol_0.48.0_linux_amd64.deb
$ dpkg -i otelcol_0.48.0_linux_amd64.deb
{ .overflow-wrap-anywhere }
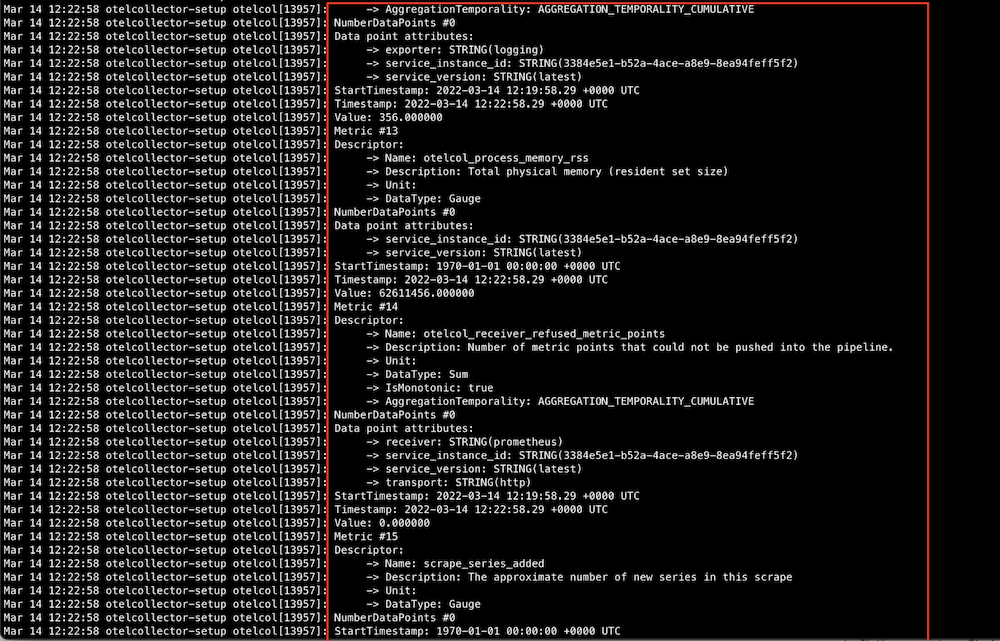
Let’s first check if the collector is successfully running by checking the logs:
$ journalctl -u otelcol.service -f
This will show the logs of the collector, which should resemble something like this:
Lets now figure out what all the logs are about by looking at the config file at:
/etc/otelcol/config.yaml
$ cat /etc/otelcol/config.yaml

extensions:
  health_check:
  pprof:
    endpoint: 0.0.0.0:1777
  zpages:
    endpoint: 0.0.0.0:55679

receivers:
  otlp:
    protocols:
      grpc:
      http:

  opencensus:

  # Collect own metrics
  prometheus:
    config:
      scrape_configs:
      - job_name: 'otel-collector'
        scrape_interval: 10s
        static_configs:
        - targets: ['0.0.0.0:8888']

  jaeger:
    protocols:
      grpc:
      thrift_binary:
      thrift_compact:
      thrift_http:

  zipkin:

processors:
  batch:

exporters:
  logging:
    logLevel: debug

service:

  pipelines:

    traces:
      receivers: [otlp, opencensus, jaeger, zipkin]
      processors: [batch]
      exporters: [logging]

    metrics:
      receivers: [otlp, opencensus, prometheus]
      processors: [batch]
      exporters: [logging]

  extensions: [health_check, pprof, zpages]
So the Otel Collector’s pipeline has 3 steps:
Receivers —> Processors —> Exporters
It collects telemetry data via the receivers and applies transformations in the processors stage before sending it to various outputs via exporters.
You can see the final definition of the pipeline under the pipelines section at the end of the config file. The default config has 2 pipelines configured, one for traces and one for metrics. And the metrics pipeline looks like this:
metrics:
  receivers: [otlp, opencensus, prometheus]
  processors: [batch]
  exporters: [logging]
This basically means we can receive metrics via OTLP, OpenCensus and Prometheus, and the batch processor batches together several metrics before sending them to the logging exporters (basically log to stdout).
Given we don’t need any tracing, OTLP, or OpenCensus, we can simplify the config to the following:
receivers:
  # Collect own metrics
  prometheus:
    config:
      scrape_configs:
      - job_name: 'otel-collector'
        scrape_interval: 10s
        static_configs:
        - targets: ['0.0.0.0:8888']

processors:
  batch:

exporters:
  logging:
    logLevel: debug

service:

  pipelines:
    metrics:
      receivers: [prometheus]
      processors: [batch]
      exporters: [logging]
Once you update the config file at /etc/otelcol/config.yaml to the above config, let’s restart the collector to make sure everything is fine :)
$ systemctl restart otelcol.service
$ systemctl status otelcol.service
Now that that is done, let’s look at the Prometheus config:
prometheus:
  config:
    scrape_configs:
    - job_name: 'otel-collector'
      scrape_interval: 10s
      static_configs:
      - targets: ['0.0.0.0:8888']
The Prometheus receiver supports the Prometheus config file out of the box, with very few limitations.
The default config scrapes the collector itself for metrics on how the collector is performing. Adding more sources to scrape is quite easy, and it’s as simple as adding more targets / jobs:
prometheus:
  config:
    scrape_configs:
    - job_name: 'otel-collector'
      scrape_interval: 10s
      static_configs:
      - targets: ['0.0.0.0:8888']
    - job_name: 'node'
      scrape_interval: 10s
      static_configs:
      - targets: ['localhost:9100']
Now that we have our exporters added, let’s start sending them to Grafana Cloud. For this, we need a Prometheus remote write exporter:
exporters:
  prometheusremotewrite:
    endpoint: https://USER:PASSWORD@URL
Now this is where the Grafana Cloud config comes into play. For example, for me the endpoint looks like this:
exporters:
  prometheusremotewrite:
    endpoint: https://361398:eyJrIjoiYTNlZTFiOTc2NjA2ODJlOGY1ZGRlNGJkNWMwODRkMDY2M2U2MTE3NiIsIm4iOiJtZXRyaWNzLWtleSIsImlkIjo2MTU4ODJ9@prometheus-prod-01-eu-west-0.grafana.net/api/prom/push
{ .overflow-wrap-anywhere }
(Don’t worry, I revoked the API Key ;))
When you add the exporter, also update the pipeline, and the final config will look something like:
receivers:
  # Collect own metrics
  prometheus:
    config:
      scrape_configs:
      - job_name: 'otel-collector'
        scrape_interval: 10s
        static_configs:
        - targets: ['0.0.0.0:8888']
      - job_name: 'node'
        scrape_interval: 10s
        static_configs:
        - targets: ['localhost:9100']

processors:
  batch:

exporters:
  logging:
    logLevel: debug

  prometheusremotewrite:
    endpoint: https://361398:eyJrIjoiYTNlZTFiOTc2NjA2ODJlOGY1ZGRlNGJkNWMwODRkMDY2M2U2MTE3NiIsIm4iOiJtZXRyaWNzLWtleSIsImlkIjo2MTU4ODJ9@prometheus-prod-01-eu-west-0.grafana.net/api/prom/push

service:
  pipelines:
    metrics:
      receivers: [prometheus]
      processors: [batch]
      exporters: [prometheusremotewrite]
{ .overflow-wrap-anywhere }
Once you update /etc/otelcol/config.yaml with the above (make sure you’re using the right USER, PASSWORD, and URL), restart and verify the collector is running successfully:
$ systemctl restart otelcol.service
$ systemctl status otelcol.service
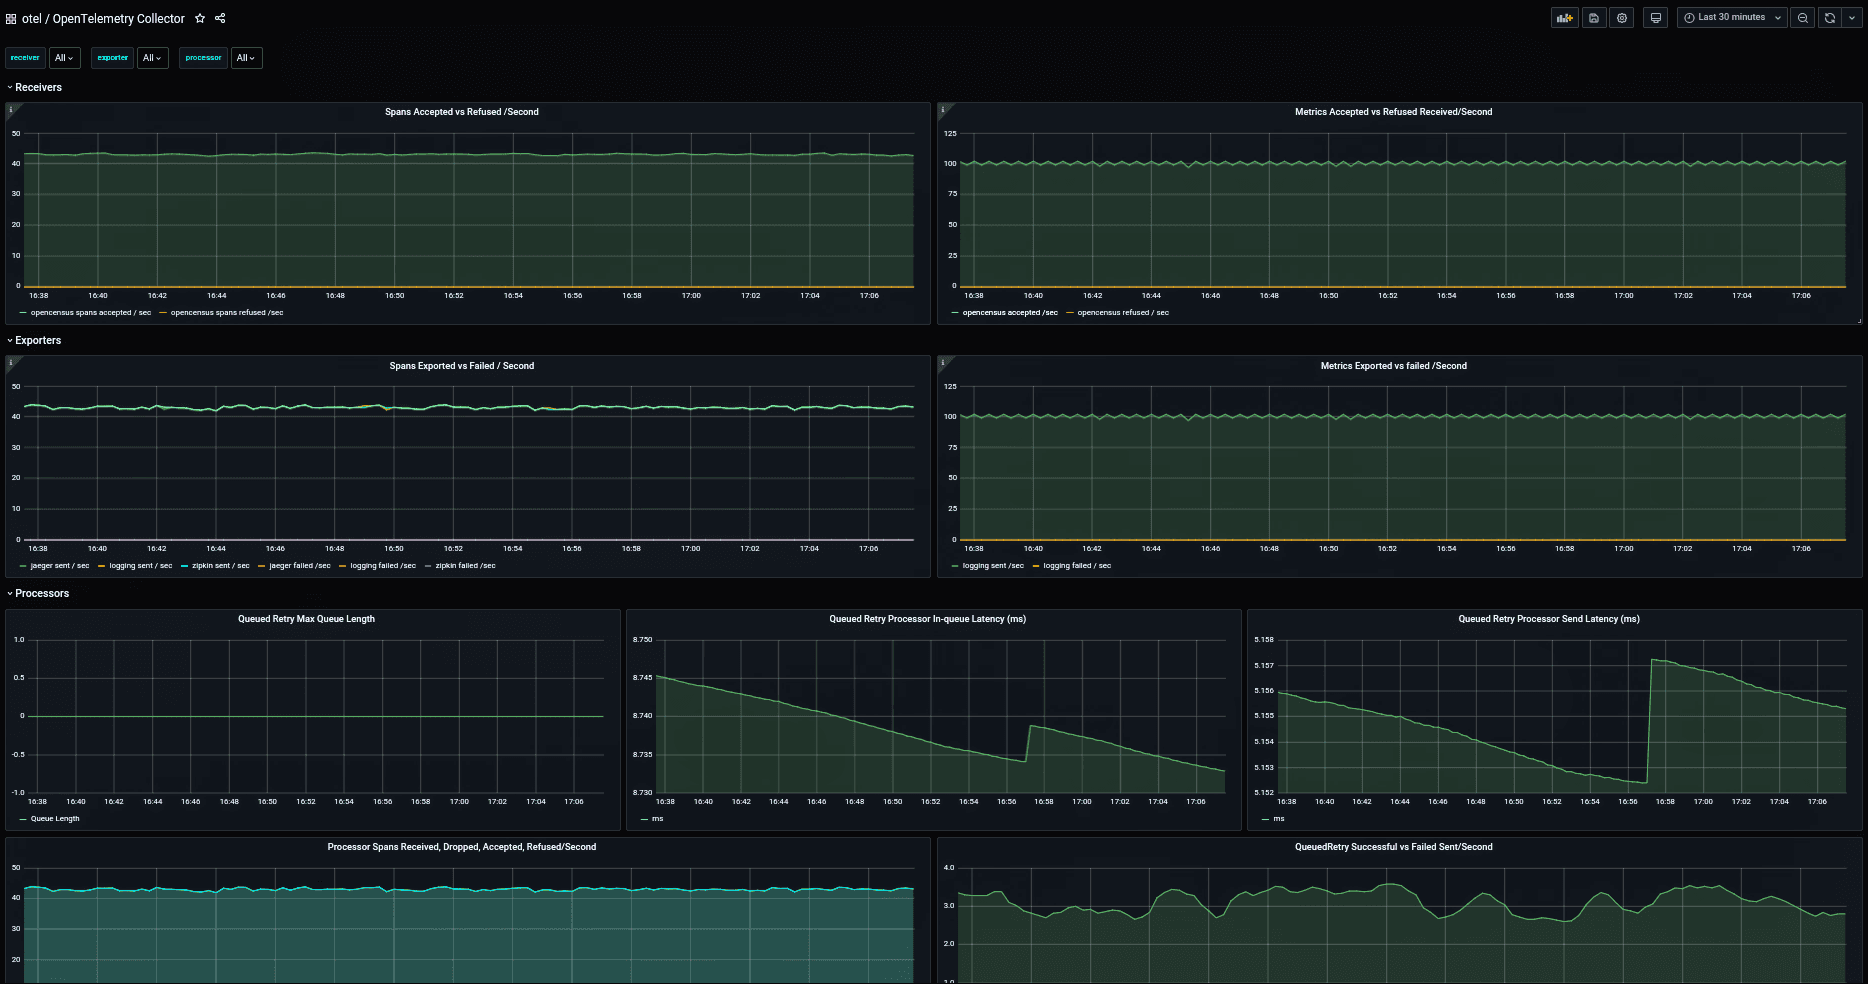
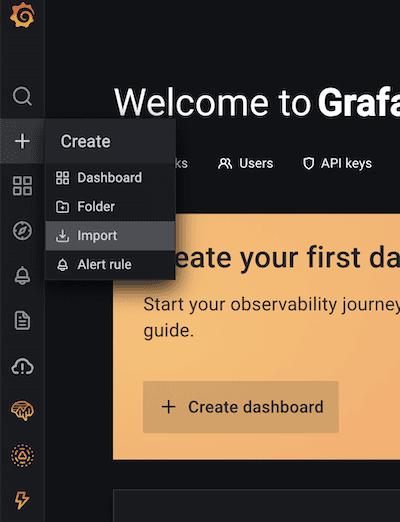
Now in your Grafana instance on Grafana Cloud, you should see the metrics start flowing in. Let’s import this popular Node Exporter dashboard to visualize those metrics.
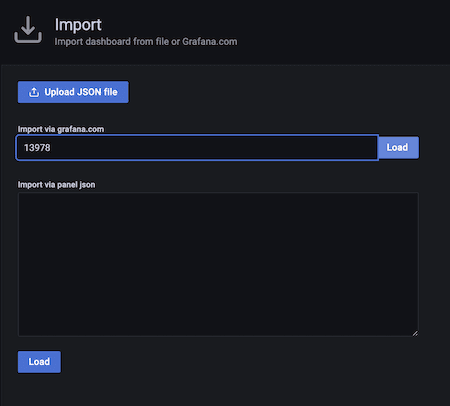
This will load the dashboard. Give it a few minutes, and you should see the panels populate with the data on how your Linux node is performing!
In the future, we will cover how you can deploy the collector into Kubernetes with the operator and how you can scrape metrics in Kubernetes. We will also look into how to better use the different Prometheus components inside the collector!
Grafana Cloud is the easiest way to get started with metrics, logs, traces, and dashboards. We have a generous free forever tier and plans for every use case. Sign up for free now!

