

Intro to synthetic monitoring - and Grafana Labs’ new iteration on worldPing
Often there’s a focus on how a service is running from the perspective of the organization. But what does service health monitoring look like from the perspective of a user?
Today, understanding your end users’ experience is a key component of ensuring your website or application is functioning correctly. Having a website that is performing well regardless of location, load, or connection type is no longer a nice-to-have, but rather a requirement.
That’s where synthetic monitoring comes in. It works by continually testing, storing, and alerting on the global performance and availability of your applications so you can pinpoint issues, fix them immediately, and improve your users’ experience.
Let’s go through the basics of synthetic monitoring and how you can proactively monitor your end-user experience with Grafana. We also invite you to join us Wednesday, October 7, for a webinar on synthetic monitoring.
Synthetic monitoring 101
In a nutshell, synthetic monitoring helps you understand your user’s experience and improve website performance by proactively monitoring your services. Synthetic monitoring is the best way to observe how systems and applications are performing by simulating the user experience. When you have the ability to look into services and applications “from the outside in,” it’s easier to manage your SLAs and SLOs and ensure uptime across your environment. With synthetic monitoring, you will be able to answer questions like:
- Is my website up?
- How fast is my site at this moment?
- Are transactions working?
- How cost-effective is my performance?
- If there is a slowdown or failure, where is it?
This type of monitoring can be done in many ways, but let’s break down three of the primary approaches — blackbox monitoring and whitebox monitoring — and why they’re important.
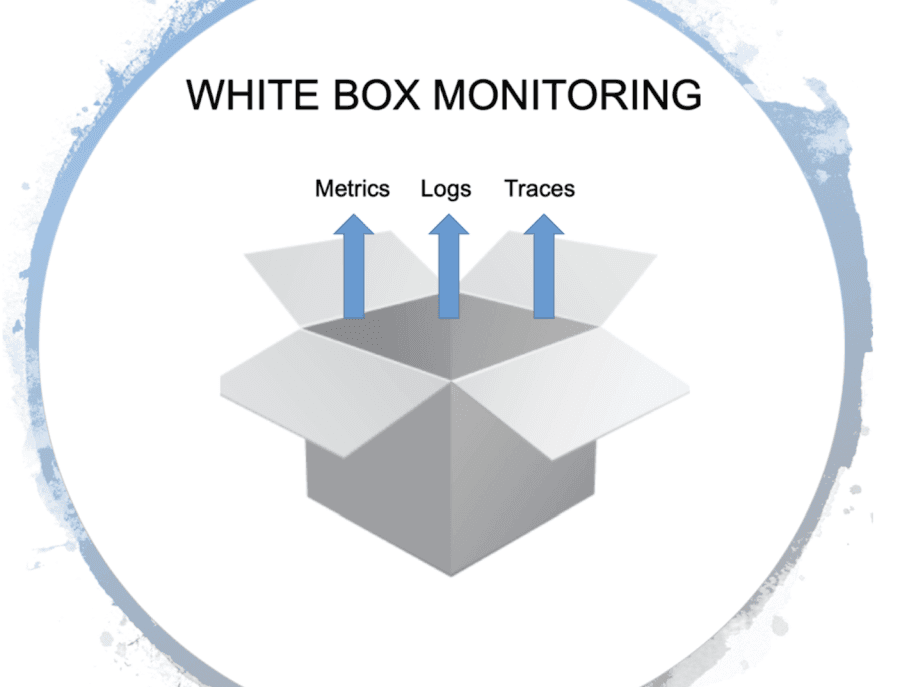
Whitebox monitoring
At the highest level, whitebox monitoring gives you insight into what is happening inside an application.This type of monitoring works by instrumenting applications — metrics, logs, traces — so you can understand how your system is performing at a high level, but also gives you the ability to drill deeper into what is happening inside an application and understand the interactions between all of the internal components.
Whitebox monitoring is particularly useful for monitoring operational metrics. For example, if you notice your database cluster node is offline or running low on storage, you can drill in and understand if this database is causing slowdowns in your system.
However, with this approach, it is up to the developers to instrument applications to ensure they emit the desired metrics, logs, and/or traces that capture the behavior of the application with sufficient detail. The level of visibility is only limited by the level of instrumentation added to the application.
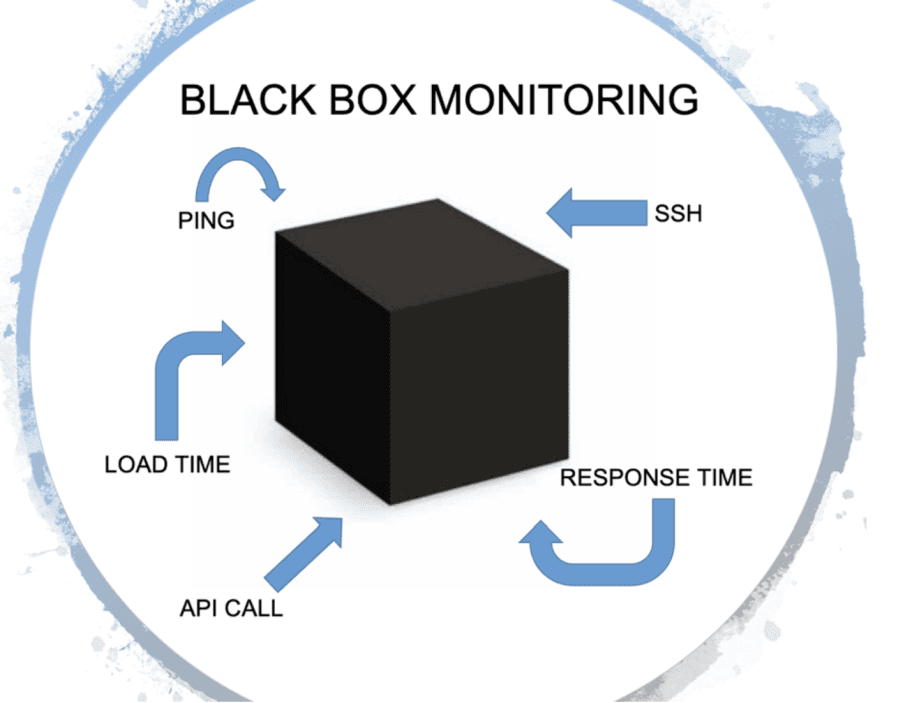
Blackbox monitoring
While whitebox monitoring is great for providing insight into your application, it can’t give you a complete view of what your users are experiencing — and this is where blackbox monitoring comes in. Blackbox monitoring provides an external view of how an application is behaving. With this approach, services are monitored by sending requests and analyzing the responses returned.
Blackbox monitoring is great for doing simple A/B testing, so you can continually test to see if your services are up, and compare the experience across different users.
Another example where blackbox monitoring is particularly useful is for network requests, since there are a number of stages in the request process where things can go wrong or slow down. Blackbox monitoring provides a level of insight so that when things do go wrong, you can quickly troubleshoot a large range of failure modes and diagnose the issue faster.
One of the main benefits to this approach is that it doesn’t require making any changes to an application or require additional setup. This is important because there can be systems that you don’t control, or where you can’t add more instrumentation but still need to be able to observe what’s happening. You can easily do this with blackbox monitoring since all that is needed is some monitoring software that can send requests and record the results.
Blackbox monitoring + whitebox monitoring in Grafana
The best results are achieved when you combine whitebox and blackbox monitoring. This is where Grafana really shines, because it allows users to combine blackbox and other monitoring data in the same dashboard. Users can really gain a complete end-to-end view of how a service is performing.
Synthetic monitoring at Grafana Labs
If you are using Grafana, or joined us in May for GrafanaCONline, you are probably familiar with worldPing, our open source plugin monitoring performance and uptime of your Internet application. We’ve made some significant improvements to worldPing over the past few years, and we recently unveiled the newest iteration called Synthetic Monitoring, which is available now in Grafana Cloud.
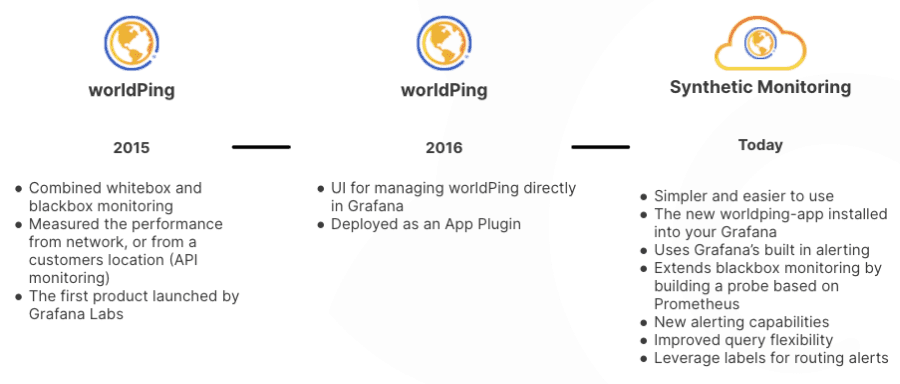
Compared to worldPing, Synthetic Monitoring focuses on reducing complexity and taking advantage of Grafana Cloud capabilities. Everything you love about worldPing is available in Synthetic Monitoring, but it’s been enhanced to provide a more robust synthetic monitoring experience. Some of those key enhancements include:
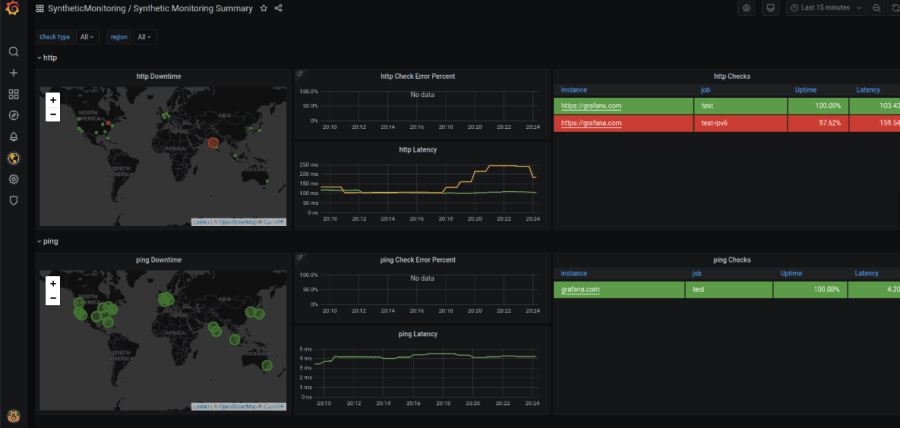
1. Collecting metrics and logs on every check: With worldPing, we received regular inquiries from customers asking for help troubleshooting issues with the endpoints they were monitoring so they could fully understand why a check had failed. Synthetic Monitoring is different because as each check runs, metrics and logs are collected and published to the user’s Grafana Cloud service. Metrics are published to Grafana Cloud Prometheus, and logs are published to Grafana Cloud Loki. By adding logs from checks, users now have more data so they can troubleshoot more efficiently.
2. Data is stored in Grafana Cloud: worldPing stores metrics in a dedicated time series database, which means that data is isolated and only contains data specific to worldPing. With Synthetic Monitoring, data is pushed directly into the user’s Grafana Cloud logs and metrics instances.
3. Expanded blackbox monitoring capabilities: With the new blackbox exporter, users get key metrics, such as SSL certificate expiration times, TCP- and HTTP-based checks, as well as Ping and DNS checks.
4. Alerting: Synthetic Monitoring allows users to create alerts based on thresholds they define and leverages Grafana’s numerous notification channels to ensure these alerts are making their way to the right people.
These are just some of the new capabilities that are available with Synthetic Monitoring.
Learn more about Grafana Labs’ Synthetic Monitoring this week
If you’re using worldPing today, or want to learn more about Synthetic Monitoring, we encourage you to join us Wednesday, October 7, for a webinar, Introducing Synthetic Monitoring.
For current worldPing users, you’ll learn:
- Additional features you’ll have access to in Synthetic Monitoring that weren’t available in worldPing
- How to migrate checks from worldPing to Synthetic Monitoring
- Differences in billing in worldPing vs. Synthetic Monitoring
In this interactive webinar, we’ll also walk you through how to get started and a full demo of Synthetic Monitoring, so you can see first-hand how easy-to-use and customizable it is.

