Take a peek inside the latest version of the Dynatrace Enterprise plugin for Grafana
This post has been updated to reflect changes in the availability of the Dynatrace data source plugin for Grafana Cloud users.
Hi, everyone! In honor of binge watching every season of Community over the last few weeks, we (Eldin and Christine) have been inspired to rebrand ourselves as none other than our other favorite dynamic duo, Troy and Abed! Yet, instead of singing “Troy and Abed in the Morning,” we are back to write about some useful improvements we’ve made to our Dynatrace Enterprise plugin.
Dynatrace is a leading APM solution popular for its ability to show you everything that is going on in your application environments and how it impacts your end users. By integrating Dynatrace with Grafana, you can easily create user-friendly, exec-ready dashboards from your Metrics API v2 data and custom metrics.
Once you’ve installed the data source — which is available to users with a Grafana Cloud account or with a Grafana Enterprise license— elect the Dynatrace API Type (either SaaS or on-prem Managed Cluster and fill out the Environment ID, API token, and Domain if using Managed Cluster).

As a jumping off point for your dashboards, once you’ve added the configuration details, you can move over to the Dashboards tab in the data source settings page and import a quick-start dashboard to get you started:

Once you’ve imported the dashboard, you will immediately see your Dynatrace data in a Grafana dashboard!

Use the dashboard as an inspiration for how you can reimagine your metrics using Grafana features such as transformations and a variety of built-in panel types such as our beloved stat panel and the ever-popular gauge panel.
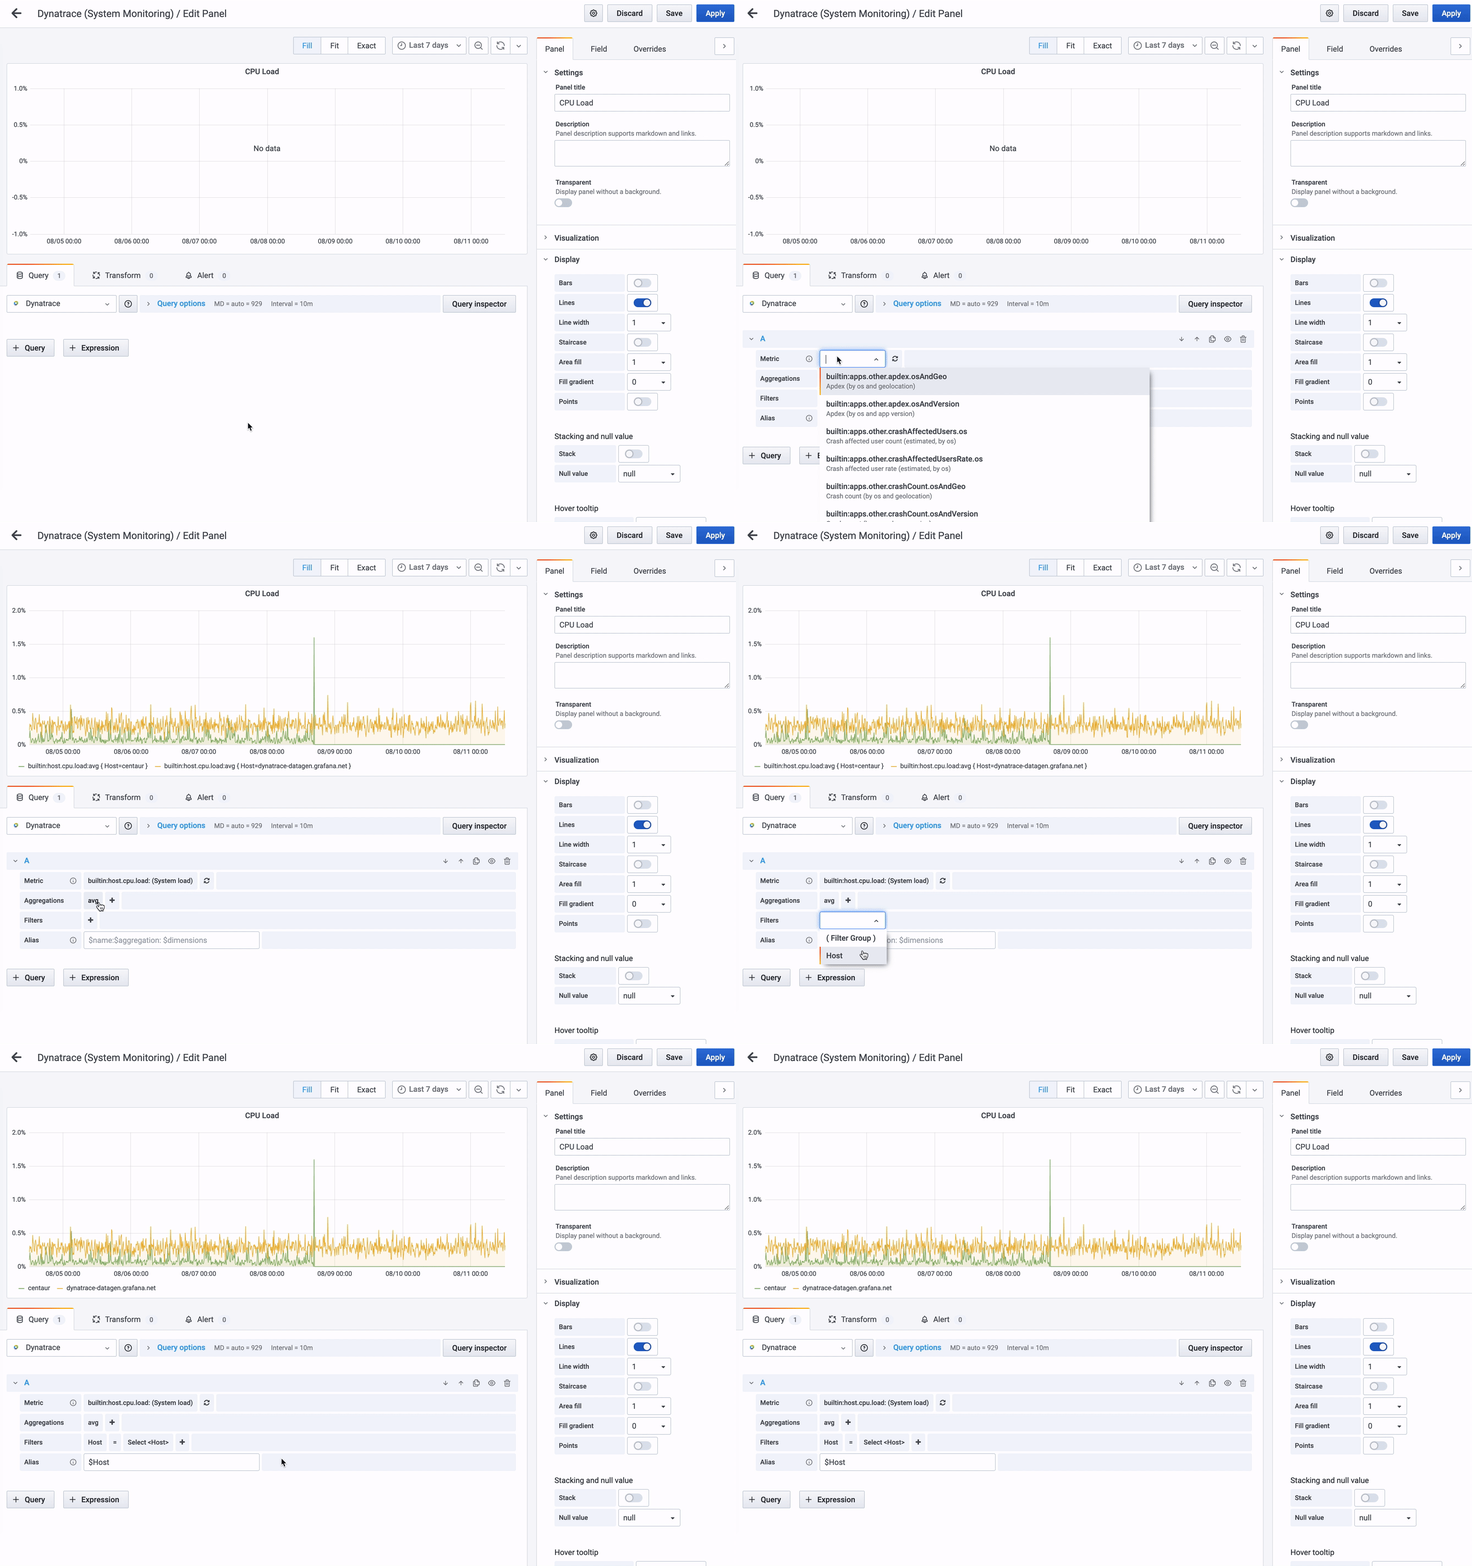
Let’s take a look at the query editor. The Dynatrace query editor is a visual drop-down menu that makes it easy for you to compose a query. Start by selecting a Metric; as you type, you will see that the field autocompletes to a metric name. Then, apply an aggregation to your query such as average or max. The Dynatrace plugin will dynamically query the appropriate filters for each metric label so you can apply a filter to your query as well (such as Host = Centaur). You also have the ability to alias your metric names so they are much easier to understand for your viewers — we’ll discuss this feature more in the next paragraph.

In order to make your metric names easier to understand for your viewers, you can alias them. Hover over the tooltip for some examples of aliases you could use:

We provide two different types of aliases; the first is a static alias that is available on every query you build. A static alias starts with a lowercase letter, such as $name. The second type of alias is a dynamic alias that will change depending on the metric you are using in your query. These types of aliases will start with an uppercase, such as $Host. In the example above, you have four possible aliases you could use. The first three are static, and the last one is dynamic.
You could also, if you’d like, hardcode an alias name by simply typing in whatever you want in the Alias field!
The Dynatrace plugin also supports ad hoc filters so you can quickly set up key/value filters for your dashboards without needing to create variables or use variables in your queries. Read more about Dynatrace ad hoc filters (and all other plugin features) in the documentation.
If you’re more of a ditch-the-UI kind of user, here is how you would provision the Dynatrace plugin with a config file:
datasources:
  - name: Dynatrace
    type: grafana-dynatrace-datasource
    access: proxy
    editable: true
    enabled: true
    jsonData:
      apiType: saas or managed
      environmentId:
    secureJsonData:
      apiToken:
    version: 1
We hope you enjoyed today’s post. The Dynatrace Enterprise plugin is available for users with a Grafana Cloud account or with a Grafana Enterprise license. For more information and to get started, check out the Dynatrace solutions page or contact our team.
Troy and Abed, out!
If you’re not already using Grafana Cloud — the easiest way to get started with observability — sign up now for a free 14-day trial of Grafana Cloud Pro, with unlimited metrics, logs, traces, and users, long-term retention, and access to one Enterprise plugin.


