

How Grafana Labs enables horizontally scalable tail sampling in the OpenTelemetry Collector
Tracing is a widely adopted solution to provide performance insights into distributed applications. It is a valuable resource for developers to view the service call graph and track service latency at a granular level. It’s also a handy tool for on-call engineers to drill down and debug a problematic service during an outage. There are a number of open source distributed tracing frameworks out in the wild, including Jaeger, Zipkin, and OpenTelemetry. These provide libraries to instrument client applications, as well as components to process, store, and query trace data.
At Grafana Labs, we use Jaeger and OpenTelemetry extensively to track performance of various projects in production including Cortex, Metrictank, and Loki.
Sampling: dealing with large data volumes
Since most of the traces in a healthy application are almost the same, storing all traces from an application can often be overkill as well as increase operational cost. Sampling is a good method to throttle down and store representative traces, and in most implementations, the sampling decision is made upfront and at random (probabilistic). But this form of sampling, often called head-based sampling, can miss out on important traces that we are interested in, such as traces with errors or high latencies, which may never get sampled because they are (hopefully!) rare.
To deal with this problem, the OpenTelemetry team implemented a processor in the collector component that performs tail-based sampling. In this form of sampling, the sampling decision is not necessarily made upfront, but rather based on conditionals evaluated on full traces that are aggregated in-memory at the collector level. Example conditions:
- http.status_code > 201
- error = true
- service = “cortex-gateway” && duration > 10s
This brings much needed flexibility to sample representative traces, as it allows us to leverage complete trace data post application processing. A combination of head and tail based sampling can be used depending on the traffic through the cluster, and the desired storage capacity for traces.
The problem
The OpenTelemetry Collector does not perform tail sampling when scaled horizontally. When multiple instances of the collector are deployed, spans belonging to the same trace could end up with different collectors. Since these instances have no way of communicating with each other, each of the instances would make a tail sampling decision on a partial trace – a subset of spans – that reached the particular instance. This could cause unexpected results where only a subset of spans in a trace that satisfied the sampling conditions is saved to the backend.
The solution
In order to make the tail sampling processor horizontally scalable, we designed a new processor, called the aggregate processor. This processor solves the problem by forwarding spans between the collectors in a way that all spans with the same traceID end up at the same collector. This ensures that each instance of the collector can make a sampling decision on the entire trace, and no partial traces are flushed to the backend.
The aggregate processor works by discovering peer instances of the collector via DNS (this can easily be extended to include plugins for etcd, Consul, etc.) and forwarding spans to peers based on traceIDs. To determine which peer a particular span should be forwarded to, each collector instance performs a fnv hash of the traceID, followed by a jumphash. This addresses two problems:
- The fnv hash is used to protect against bad instrumentation of the client applications wherein traceID generation does not use the entire 128 bit keyspace.
- Jumphash ensures that redistribution of traceIDs is minimized when scaling the number of collectors. In simple modulo hash, a lot of spans would be “orphaned” during collector churn, because each collector repartitions the entire keyspace, whereas with jumphash, at most 1/N of the traces will be repartitioned, where N is the number of instances.
By adding the aggregate processor before the tail sampling processor in the processing pipeline, we ensure that all spans of a single trace are forwarded to the same collector instance. Once a trace can be assembled in-memory, conditions as discussed above can be applied to make a sampling decision.
Results
We have been using the collector with the aggregate and tail sampling processor in our internal infrastructure. We are ingesting ~14k spans a second with ~60 spans per trace with success. These are some graphs from our internal deployment of the OpenTelemetry Collector:
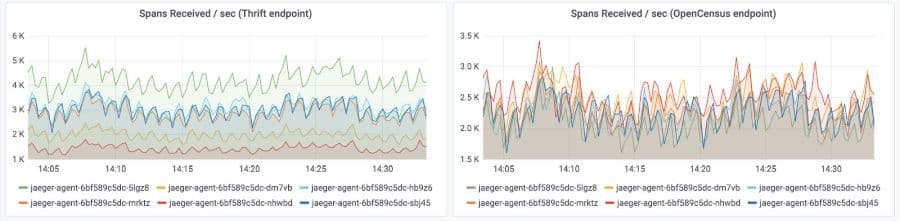
- Spans received from the application at the thrift endpoint.
- Spans forwarded between peers and received at the OpenCensus endpoint.
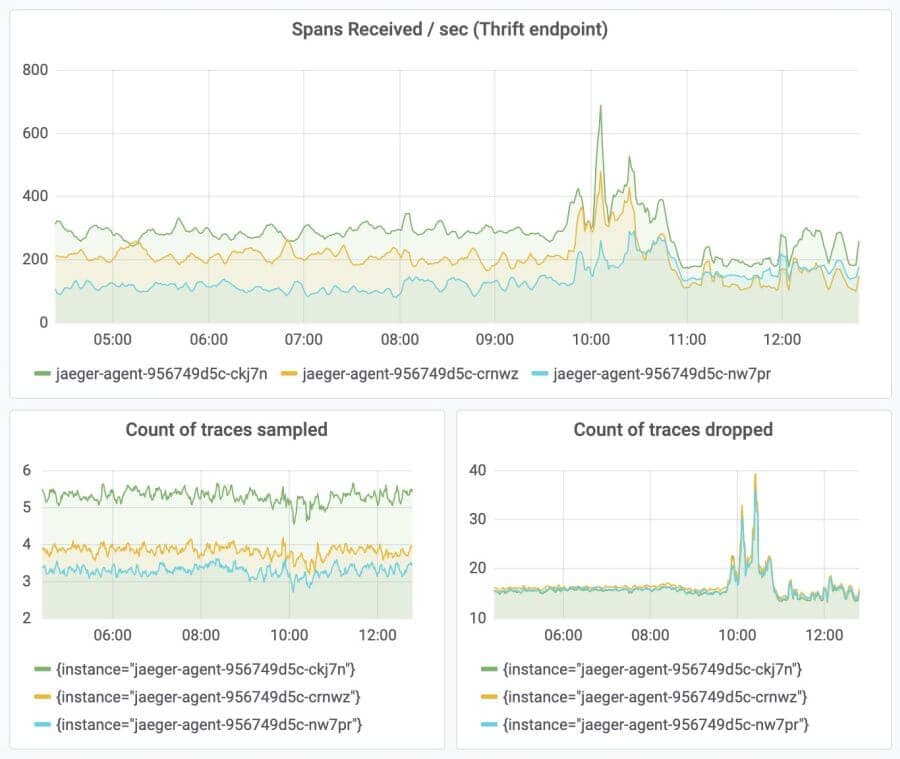
Another advantage of running the horizontal scaling tail sampling processor is that in case of a spike in incoming traffic, the storage backend is not overloaded because the number of sampled traces remains almost constant. This is depicted in the following figure: We are consistently sampling very few traces even through a spike in traffic.
Check it out!
The aggregate processor is available in our GitHub repository. A Docker image built off of this branch is also available here. Do check it out and let us know what you think!

