Docs
Grafana Cloud Synthetic Monitoring, powered by k6, tests the reliability of websites, APIs, and critical user journeys worldwide to detect issues early and ensure seamless user experiences.
Proactively monitor the performance of user flows and applications at various network levels around the globe, helping you track SLOs and SLAs
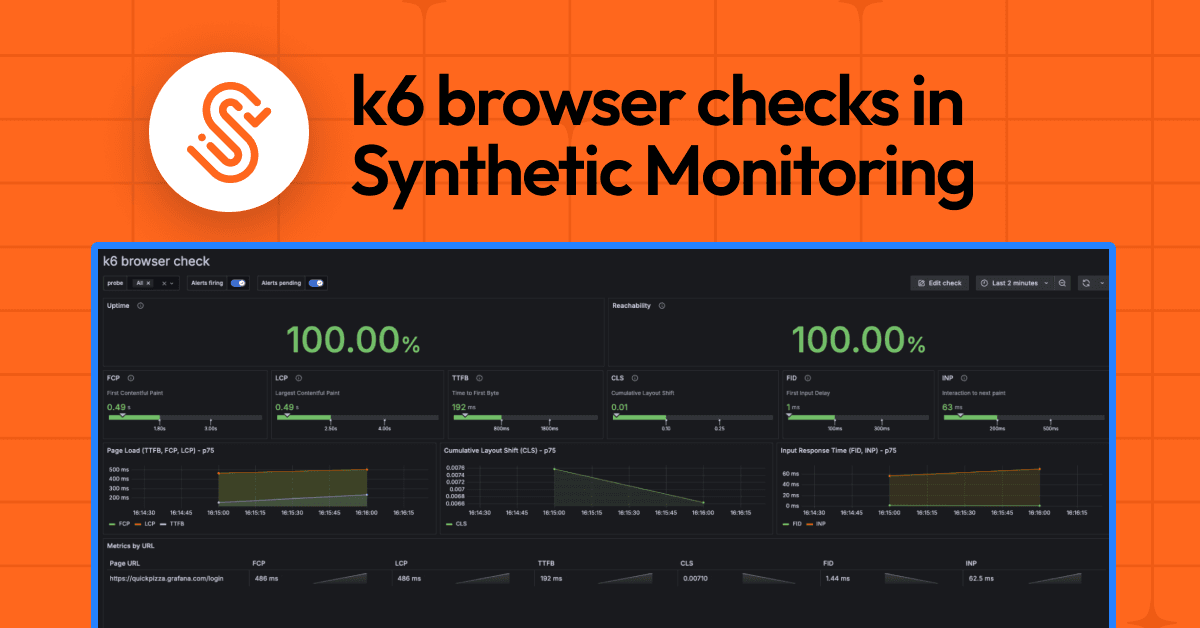
Run browser-based checks that simulate real user interactions to detect and address regressions early
Correlate Synthetic Monitoring results with metrics, logs, and traces in Grafana Cloud to pinpoint root causes quickly
Trusted by everyone from startups to the Fortune 500
Verify system performance at various network levels: Ping, DNS, HTTP, HTTPS, and TCP checks
Gain visibility into your global user experience by running checks from probe locations around the world
Visualize and alert on failures directly in Grafana Cloud
Define tests and synthetic checks with precision and flexibility using JavaScript and the k6 API
Reuse test scripts across teams for the entire software development life cycle
Store monitoring resources in your GitHub repo alongside application code
Automatically deploy and maintain checks via Terraform or the API
Track key performance metrics with out-of-the-box dashboards
Create custom dashboards, using generated metrics, for detailed analysis and reporting
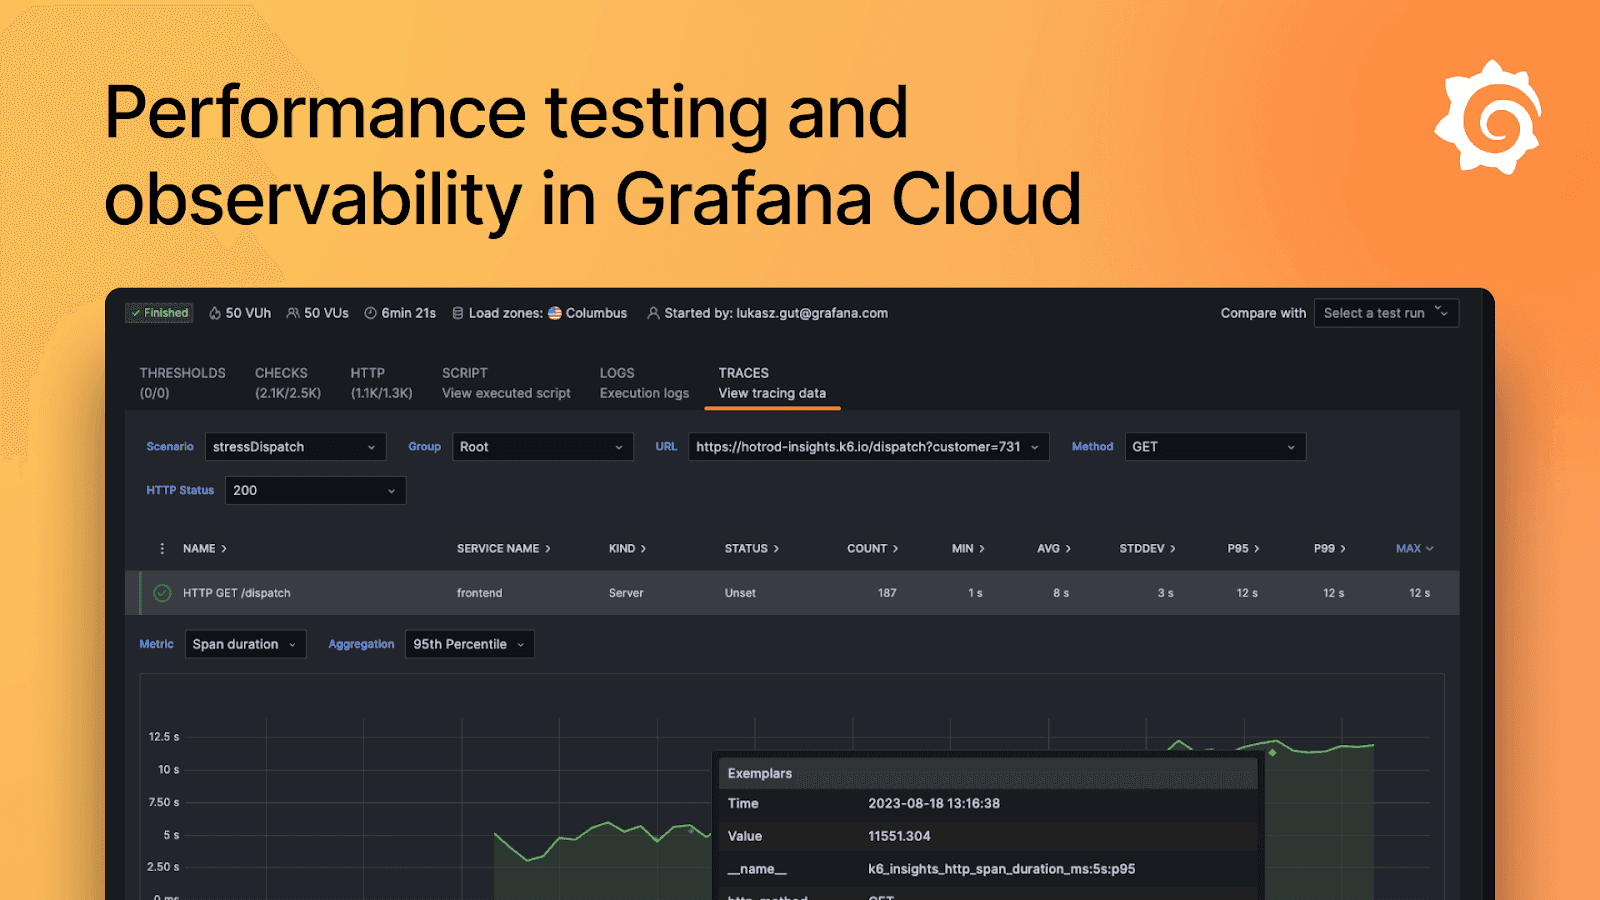
Accelerate root-cause analysis by combining Synthetic Monitoring data with metrics, logs, and traces in Grafana Explore and dashboards

“Grafana Cloud Synthetic Monitoring offers great as-code support, enabling the SRE team to streamline the creation of synthetics checks. Developers only need to provide minimal details, such as job, target, methods, and probes to get the checks they need instantly.”
Rajendra VaishnavSenior SRE, LiveRamp
No credit card required
Limited to 100k API test executions & 10k browser test executions per month
Community support
100k API test executions & 10k browser test executions per month then pay as you go
8×5 email support
Scalable unit price based on annual commit
Premium support
Deployment flexibility (Public Cloud, Federal Cloud, or Bring Your Own Cloud)
OpenTelemetry-native observability and no lock-in, with out-of-the-box solutions like Kubernetes Monitoring, Application Observability, Grafana SLO, and RUM delivered in one unified experience.
Optimize costs without sacrificing insight with Adaptive Telemetry, which filters out unused data so your budget goes toward what actually drives value. Pair with cost management tools that help you monitor, control, and tune spend.
Grafana Assistant powers agentic workflows, prebuilt dashboards, intelligent filters, and customized alerts—surfacing the data you need for faster, more efficient incident response.


Welcome to
Built on open source, open standards, and open ecosystems