OpenTelemetry for developers
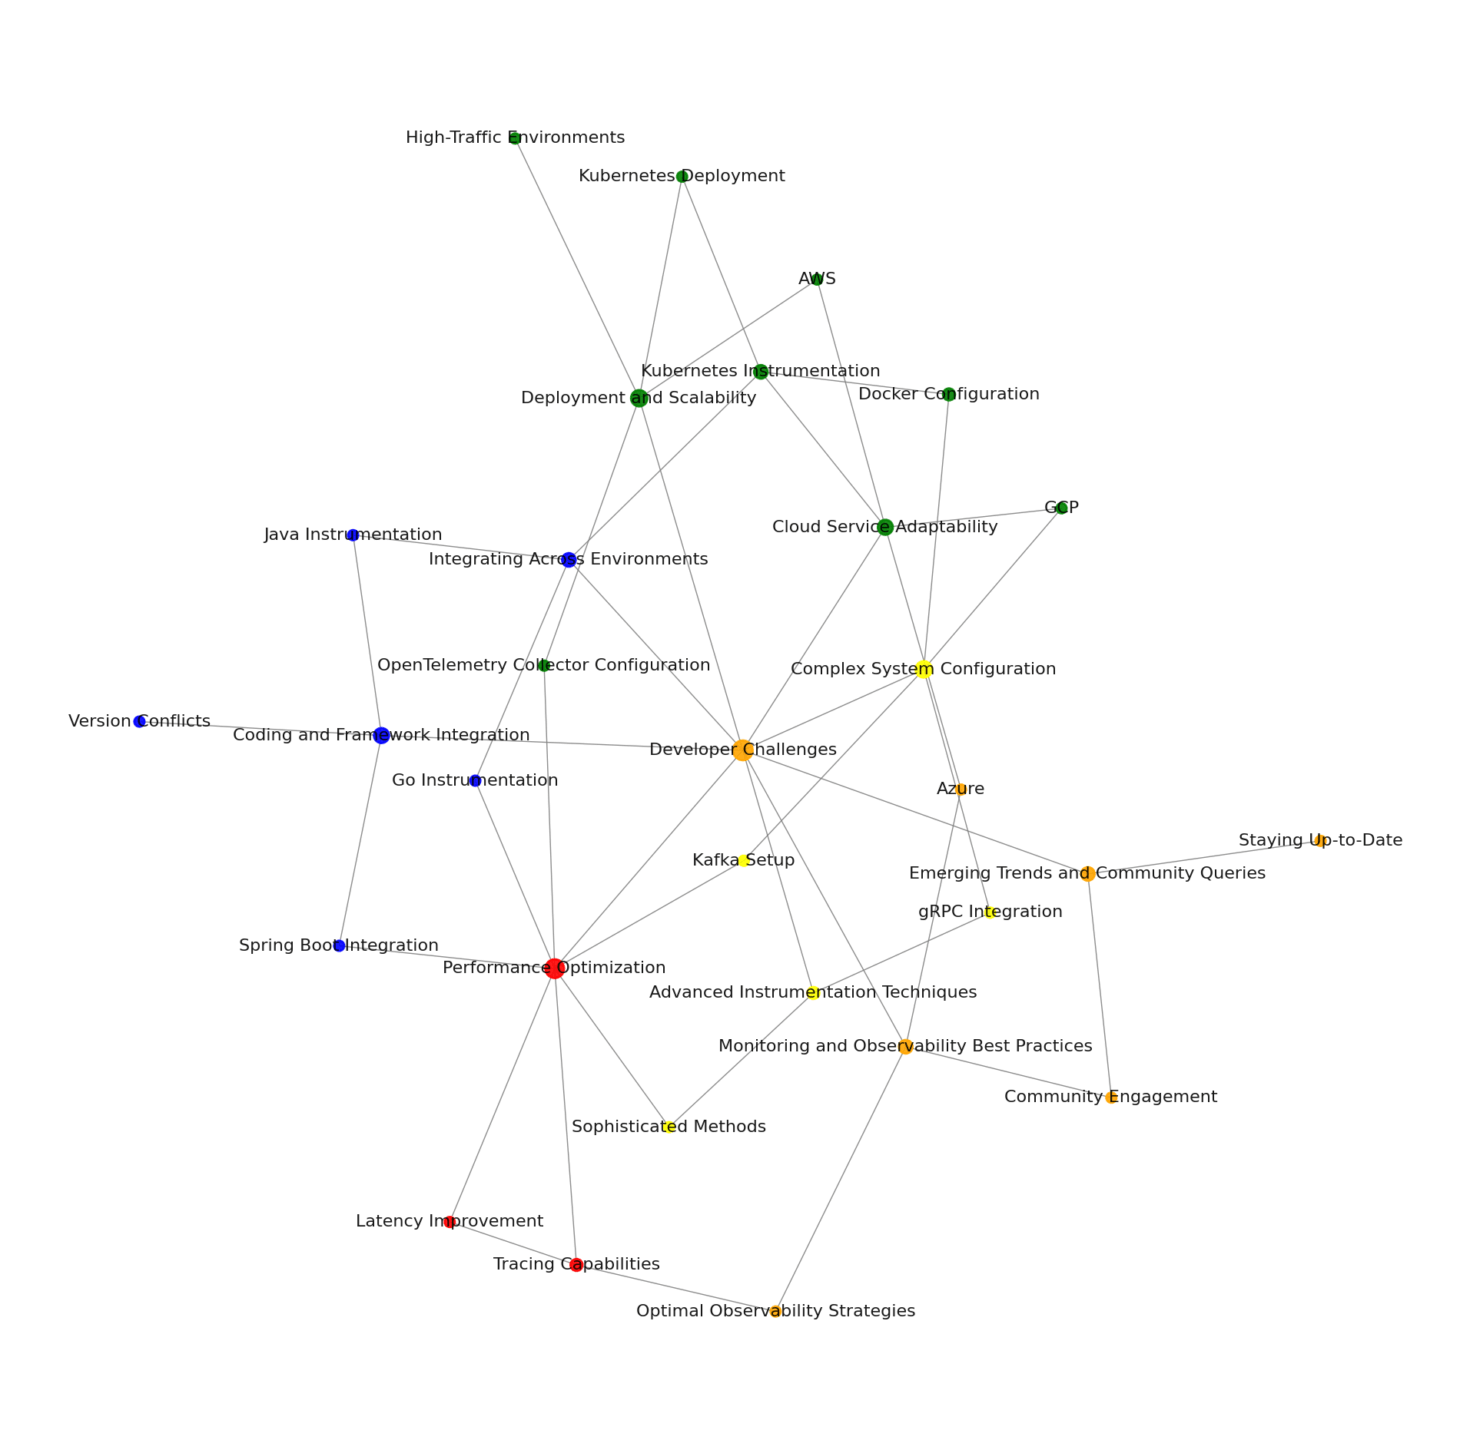
From a developer’s perspective, OpenTelemetry introduces a complex landscape of challenges that can significantly impact the development, deployment, and monitoring of applications. The first layer of complexity arises from the need to integrate OpenTelemetry across a variety of environments and cloud services, including Kubernetes, Go, Java, AWS, GCP, and Azure. Each of these platforms has unique requirements and intricacies, demanding a comprehensive understanding from developers to ensure successful implementation. This integration challenge is further exacerbated by OpenTelemetry’s rapid development pace, which can lead to gaps in documentation and the necessity for developers to continuously update their knowledge and skills to keep up with the latest changes.
Moreover, the task of configuring OpenTelemetry within complex systems that utilize technologies such as Kafka, gRPC, and Docker introduces additional hurdles. Developers must navigate through intricate configurations and potential integration issues, such as version conflicts when working with frameworks like Spring Boot. These challenges are not limited to setup and configuration; they extend into the realms of performance optimization and advanced instrumentation techniques. Developers are tasked with enhancing latency and tracing capabilities to improve application performance across various systems and services, a process that requires a deep dive into sophisticated instrumentation methods.
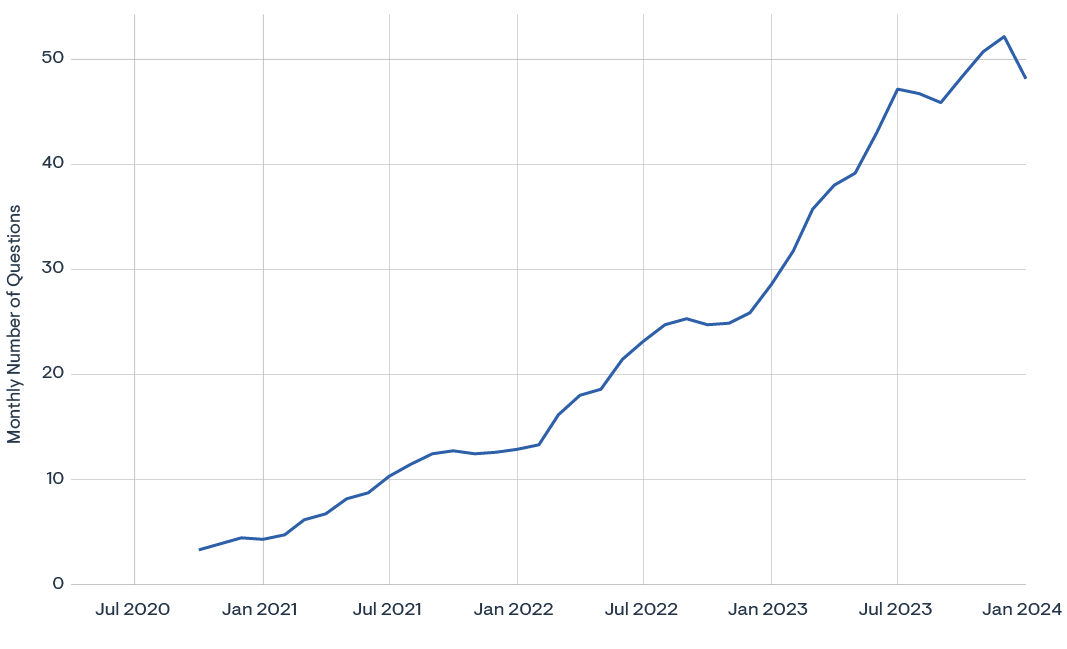
425% increase in Stack Overflow questions over 24 months
In addition to these technical challenges, the deployment and scalability of OpenTelemetry in cloud native and high-traffic environments pose significant concerns. Developers must carefully plan and execute deployment strategies to avoid performance bottlenecks and ensure system resilience. This necessitates a strong foundation in cloud native technologies and an understanding of how to scale applications effectively in such environments. As OpenTelemetry continues to evolve, staying abreast of emerging trends and community discussions becomes crucial for developers to navigate these challenges successfully.
The collective effort to overcome these obstacles not only fosters innovation, but also drives the development of best practices that can lead to more efficient and effective application monitoring solutions.
Breaking down OpenTelemetry developer challenges
1. Integrating across environments
Implementing OpenTelemetry in diverse environments like Kubernetes, Go, and Java, requires understanding the specific intricacies of each environment and how to instrument applications within them.
2. Cloud service adaptability
OpenTelemetry needs to be adaptable across various cloud services, like AWS, GCP, and Azure.
3. Complex system configuration
Setting up OpenTelemetry involves navigating through complex system configurations involving technologies like Kafka, gRPC, and Docker. This includes understanding how to configure OpenTelemetry within these systems and dealing with potential integration issues.
4. Coding and framework integration
Integrating OpenTelemetry within frameworks like Spring Boot can present specific coding challenges, including version conflicts. This requires developers to understand how to initialize and configure OpenTelemetry within these frameworks.
5. Performance optimization
Improving latency and tracing capabilities in OpenTelemetry to enhance performance across different systems and services is a significant challenge. This involves understanding how to define spans and traces manually and how to configure the OpenTelemetry Collector to gather telemetry data.
6. Advanced instrumentation techniques
OpenTelemetry offers sophisticated instrumentation methods, but understanding and implementing these techniques can be challenging due to the project’s rapid development pace and the complexity of these methods.
7. Deployment and scalability
Deploying and scaling OpenTelemetry in cloud native and high-traffic environments can be difficult. This involves understanding how to effectively deploy OpenTelemetry as a DaemonSet and deployment in a Kubernetes cluster, for instance.
8. Monitoring and observability best practices
Achieving optimal observability with OpenTelemetry involves understanding best practices for monitoring strategies. This can be challenging due to the complexity of these strategies and the need for a deep understanding of OpenTelemetry’s capabilities.
9. Emerging trends and community queries
The rapid development of OpenTelemetry and the emergence of new trends and discussions around observability can pose challenges for developers, especially those new to the project. This requires developers to stay abreast of the latest trends and community discussions.
OpenTelemetry-related topics on Stack Overflow
Top OpenTelemetry developer topics
Top 20 OpenTelemetry-related topics on Stack Overflow
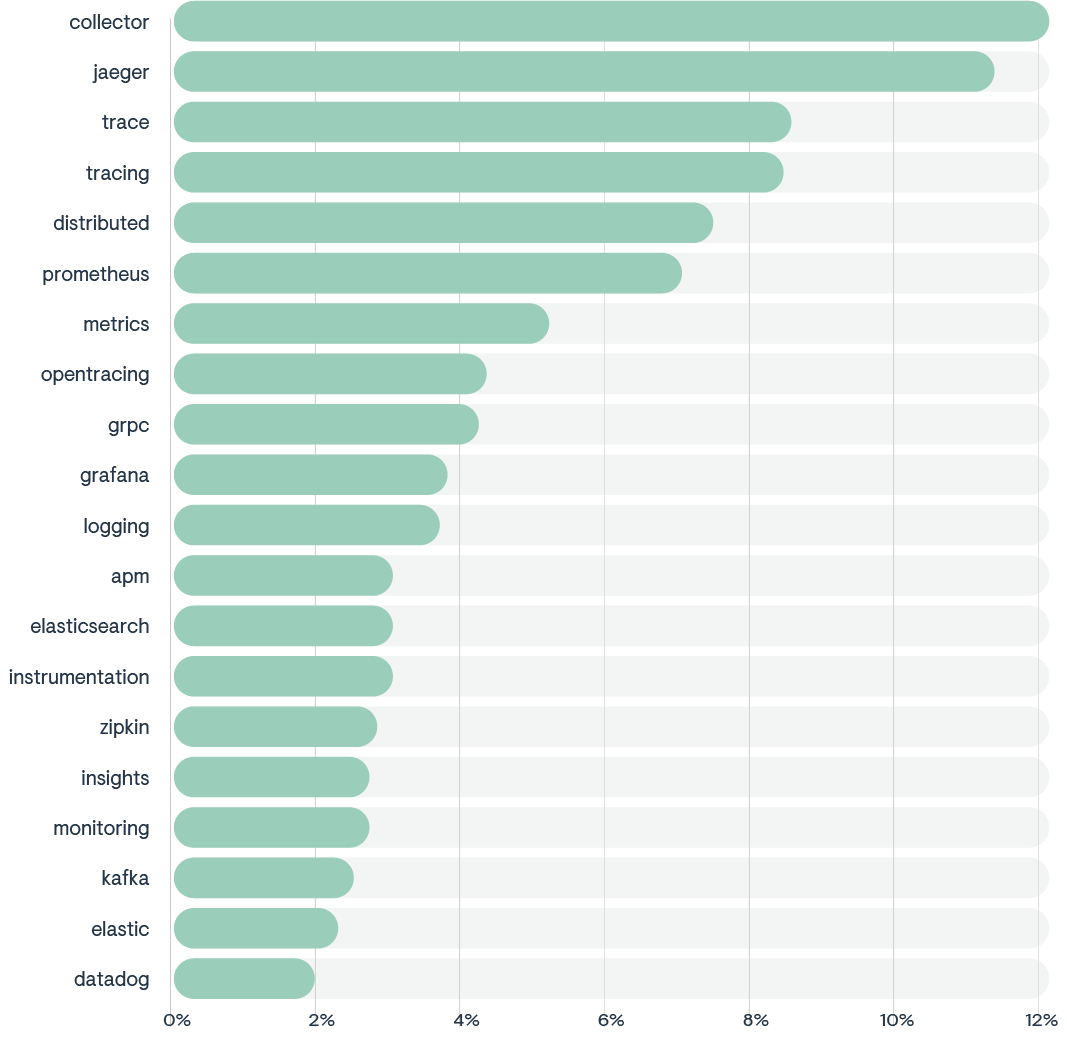
1. OTel Collector
The Stack Overflow discussions and questions provided focus on several key themes related to the configuration and operation of the OpenTelemetry (OTel) Collector, particularly in its interaction with Jaeger for tracing data.
Configuration and setup: Users are configuring the OTel Collector with various exporters and receivers, such as Jaeger and OTLP, and are facing challenges in setting up the correct configuration files and Docker Compose setups to ensure proper communication between services.
Error handling and debugging: There are instances of error messages during the setup or while running the OTel Collector, such as TRANSIENT_FAILURE states and unmarshalling errors, which indicate issues with the connection to the Jaeger backend or misconfigurations in the Collector setup.
Integration with Jaeger: The discussions show attempts to integrate the OTel Collector with Jaeger, including setting up the correct endpoints and ensuring that the Collector can send trace data to the Jaeger backend.
Troubleshooting connectivity: Users are troubleshooting connectivity issues between the OTel Collector and Jaeger, looking for ways to diagnose and resolve states where the Collector is unable to send trace data to Jaeger.
Collector performance: Questions about increasing trace buffer size and handling large amounts of trace data suggest a need for understanding and managing the performance of the OTel Collector in different environments.
These themes reflect the practical challenges and considerations that developers and operators face when deploying and managing the OTel Collector in their tracing and observability stacks.
2. OpenTelemetry + Jaeger
The provided text from Stack Overflow questions and discussions revolves around several core themes related to the use of OpenTelemetry and Jaeger for distributed tracing.
Configuration challenges: Developers face issues with setting up and configuring OpenTelemetry and Jaeger, such as setting the top-level service name, adding headers to Jaeger exporters, and configuring multiple JaegerGrpcSpanExporters.
Data propagation: There are questions about how to propagate specific data, like tenant identifiers, across all span-related calls and how to include the activity ID in response headers.
Integration issues: Developers are encountering problems when trying to integrate OpenTelemetry and Jaeger with different environments and applications, such as ASP.NET Core, Node.js apps under Docker Compose, and Spring Boot Java applications deployed in Kubernetes clusters.
Error handling: Some developers are dealing with specific error codes and compilation errors when setting up and using OpenTelemetry and Jaeger, indicating a need for better troubleshooting resources.
Deprecation concerns: There are concerns about the deprecation of certain features or tools, like the JaegerExporter, and questions about how to transition to newer tools or methods.
These themes highlight the complexities and challenges developers face when setting up and using distributed tracing tools, like OpenTelemetry and Jaeger in different environments and configurations.
3. Distributed tracing
The challenges around tracing as described in the text from Stack Overflow discussions can be summarized into several key themes.
Trace propagation: Difficulty in ensuring trace IDs are correctly propagated through different layers of an application, including across asynchronous boundaries and between services written in different languages or frameworks.
Visibility and debugging: Issues with traces not appearing in the intended backend or user interface, such as Jaeger’s UI, which can be due to misconfiguration or network issues.
Integration with tools: Challenges in integrating tracing with various tools and platforms, including Apollo GraphQL, Datadog, Dynatrace, and OpenSearch, which may behave differently in development versus production environments.
Compatibility across standards: Concerns about the compatibility of trace data when using different tracing standards or libraries, such as OpenCensus and OpenTelemetry, and whether trace context can be recognized across these systems.
Configuration complexity: The complexity of configuring tracing correctly, including setting up Collectors, exporters, and instrumentations, which can lead to silent failures or data loss if not done properly.
Performance and scalability: Managing the performance impact of tracing, such as handling large volumes of trace data or configuring sampling rates to balance detail with overhead.
Data enrichment: The desire to enrich trace data with additional information, such as method parameters or custom metrics, and the difficulty in finding documentation or support for these features.
Trace context management: Creating and managing trace contexts, especially in microservices architectures where services may use different tracing systems or require custom trace IDs and span IDs.
These themes reflect the technical and operational complexities of implementing distributed tracing in modern software systems, highlighting the need for robust configuration, clear documentation, and effective troubleshooting practices.
4. Prometheus and OpenTelemetry
The Stack Overflow discussions reveal several challenges and considerations developers face when working with metrics in cloud native applications, particularly with OpenTelemetry and Prometheus.
Instrumentation and exporting: Developers are trying to instrument .NET applications with OpenTelemetry and export metrics to Prometheus, but encounter issues such as the lack of a Prometheus exporter in certain setups.
Metric specification: There is a desire to expose specific metrics, like EF Core connection pool metrics, in a format that is compatible with Prometheus.
Filtering metrics: Users are looking for ways to filter out specific metrics based on label combinations before sending them to a central aggregator, but face difficulties with the current configuration options.
Integration with CI/CD tools: There are inquiries about monitoring tools for GitHub Actions similar to those available for GitLab CI, indicating a need for better integration between CI/CD pipelines and observability platforms.
Learning curve: Newcomers to OpenTelemetry in JavaScript environments are learning how to set up metric exporters, such as the Prometheus exporter, and integrate them with their applications.
Error handling: There are reports of errors, like HTTP 404 Not Found, when attempting to export metrics, suggesting challenges in the setup and configuration of metric exporters.
In conclusion, these discussions underscore the complexities of setting up and managing metrics in modern software environments. Developers are seeking solutions that offer clear documentation, easy integration with existing tools, and the ability to filter and customize metrics to fit their monitoring needs.
5. OpenTelemetry metrics
Based on the provided text from Stack Overflow discussions, the challenges around metrics can be summarized into several key themes.
Standardization: Questions around the standard way to expose metrics from .NET libraries, such as whether to use EventCounters or another method. Duplication of Data: Concerns about whether it’s an anti-pattern to track the same data as both a metric and as a span, potentially leading to data duplication.
Visibility: Issues with metrics not appearing in the intended backend or user interface, such as Prometheus, which can be due to misconfiguration or network issues.
Delay in processing: Experiencing significant delays between the sending of metrics and their processing, which can impact the timeliness and usefulness of the data.
Persistence of metrics: Questions about whether OpenTelemetry Metrics instrumentation needs to persist in order to properly record metrics, particularly in environments where pods are re-instantiated frequently, like Kubernetes cronjobs.
Labeling and annotation: Uncertainty about whether the k8sattributes processor adds labels or annotations of the data source or the metrics, which can impact how the data is interpreted and used.
Based on the StackOverflow discussions, the challenges around metrics in the context of cloud native applications and AI systems are multifaceted. They range from standardization issues and data duplication concerns to visibility problems, delays in processing, questions about the persistence of metrics, and uncertainties about labeling and annotation. These challenges highlight the complexity of implementing and managing metrics in modern, dynamic environments like Kubernetes, and underscore the need for robust, flexible, and efficient metrics solutions.
6. GRPC
The StackOverflow discussions reveal several challenges and considerations developers face when working with gRPC in cloud native applications, particularly with OpenTelemetry.
Context Propagation: Developers are trying to propagate OpenTelemetry context through gRPC clients, but encounter issues with missing traceparent and tracestate in the gin context.
Tracing with AWS X-Ray: Developers are facing issues with tracing gRPC calls using AWS X-Ray and OpenTelemetry. The traces stop at the gRPC call instead of continuing inside the called service.
Multiple JaegerGrpcSpanExporter configuration: Developers are trying to configure multiple JaegerGrpcSpanExporters with different service names in a Spring Boot application, but all spans are being exported to all exporters, not behaving as expected.
Connection issues: Developers are experiencing connection issues when trying to connect their application to Signoz from a different machine, resulting in a timeout error.
Correlating spans: Developers are trying to correlate spans between gRPC server and clients in the same service, but are facing difficulties in achieving this.
Illegal header value: Developers are encountering an “illegal header value” assertion error when adding span context to their client context using OpenTelemetry.
In conclusion, these discussions highlight the complexities of setting up and managing gRPC in modern software environments. Developers are seeking solutions that offer clear documentation, easy integration with existing tools, and the ability to handle context propagation and tracing effectively. These discussions underscore the need for robust, flexible, and user-friendly observability solutions that can handle the complexities of modern software systems. Clear documentation, easy integration with existing tools, and effective context propagation and tracing are essential for developers to navigate these challenges successfully.
OpenTelemetry-related technology categories
Top OpenTelemetry-related technology categories on Stack Overflow
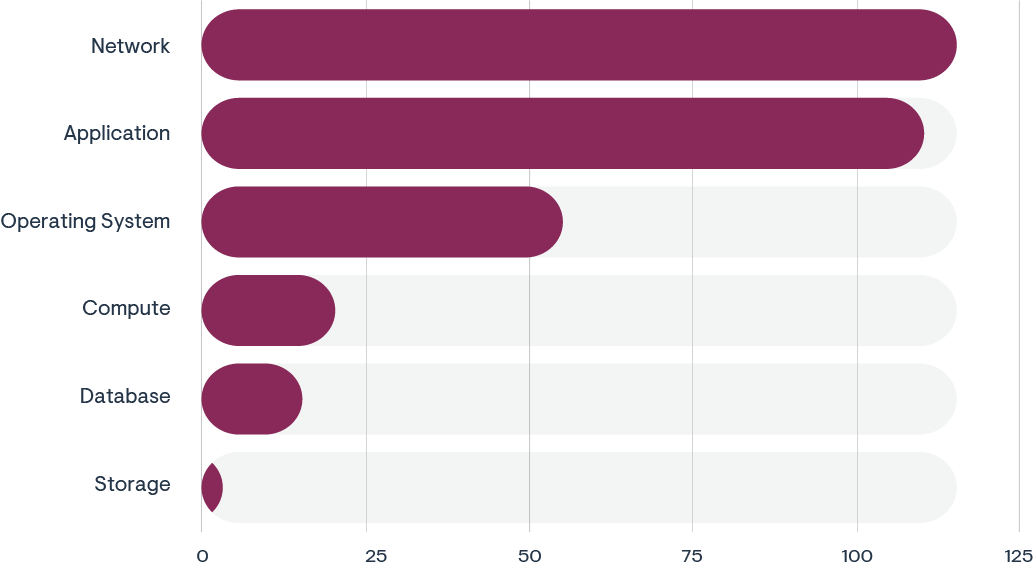
1. Network
This category has the highest number of posts, indicating that within the context of OpenTelemetry, networking is a significant topic of discussion. This could involve queries about network monitoring, performance issues, or how telemetry data is transferred across networks.
2. Application
The second-most discussed category, suggesting that OpenTelemetry’s application within software or app development is a common area of inquiry. Discussions here might involve instrumentation of applications, application performance monitoring, or application-level logging.
3. Operating system
This has fewer posts than Application, but more than Compute, Database, and Storage, indicating moderate interest or challenges in integrating OpenTelemetry with various operating systems, possibly including how OS-level metrics are captured.
4. Compute, database, storage
These categories have the least number of posts, which could suggest that while these areas are relevant to observability, they may not generate as many questions or discussions as Network and Application within the OpenTelemetry context.
OpenTelemetry problem types
Top OpenTelemetry-related problem types on Stack Overflow
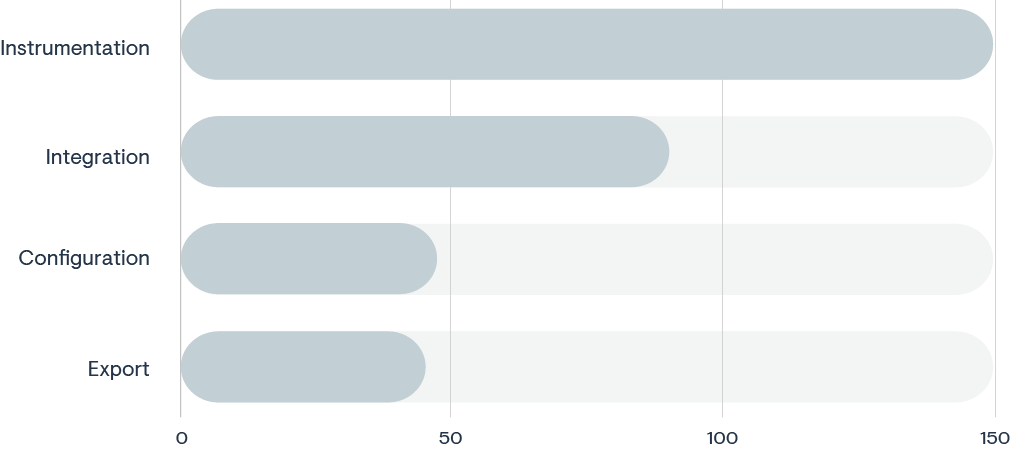
1. Instrumentation
The highest number of posts, indicating that most Stack Overflow discussions related to OpenTelemetry focus on how to implement or use the OpenTelemetry instrumentation in systems.
2. Integration
This category is also highly discussed, likely involving how OpenTelemetry integrates with other tools or services, such as observability platforms, logging systems, or cloud services.
3. Configuration
Shows a significant number of posts, which would include discussions on configuring OpenTelemetry, setting up agents, or tailoring OpenTelemetry to specific use cases.
4. Export
Has the fewest posts, suggesting that while exporting telemetry data is a part of the discussion, it is not as frequently queried as other aspects, such as instrumentation or integration.