OpenTelemetry and open source community growth
The OpenTelemetry community has experienced significant and consistent growth in popularity and contributions over the past two years. This is reflected in key GitHub metrics.
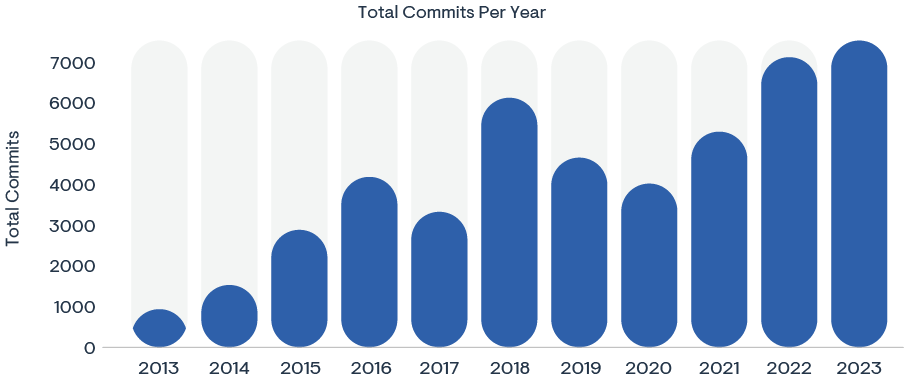
GitHub stars: The 63% year-over-year (YoY) and 136% two-year increase in GitHub stars for the top 10 OpenTelemetry repositories suggest a growing interest and appreciation for the project within the developer community. GitHub stars are often used as a measure of a project’s popularity because they indicate how many users bookmarked the project for reference or to express their liking for the project.

Code commits: The 45% YoY and 95% two-year increase in code commits indicate a high level of active participation in the project. The chart illustrates an unusually even distribution of code commits across repos. This is due to the fact that coders need to implement a similar set of instrumentation code for each development language.

Contributing coders and companies: The 25% two-year increase in contributing coders suggests that the project is attracting more individual contributors and gaining more corporate support. This could be due to the perceived value of the project in the industry, leading more companies to invest resources into contributing to its development.
Contributors and contributing organizations

These numbers collectively suggest that OpenTelemetry is gaining traction in the developer community and the industry at large. The consistent growth in contributions and interest over the past two years indicates that the project is likely to continue to grow and evolve, potentially becoming a standard tool for observability in the cloud native space.
OpenTelemetry-related GitHub repos
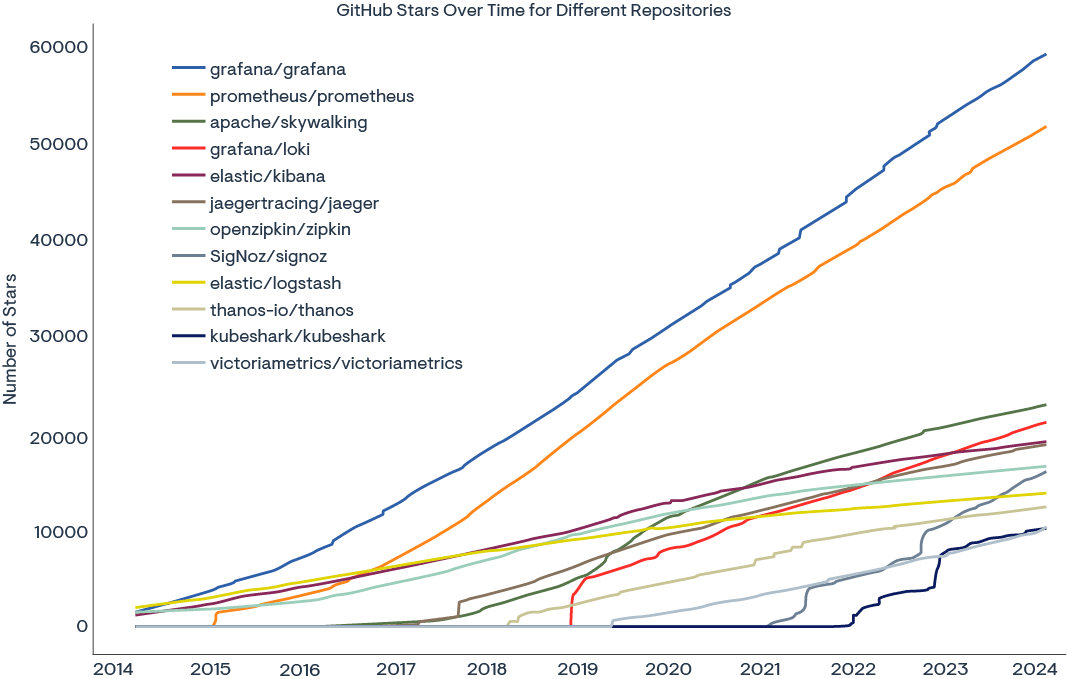
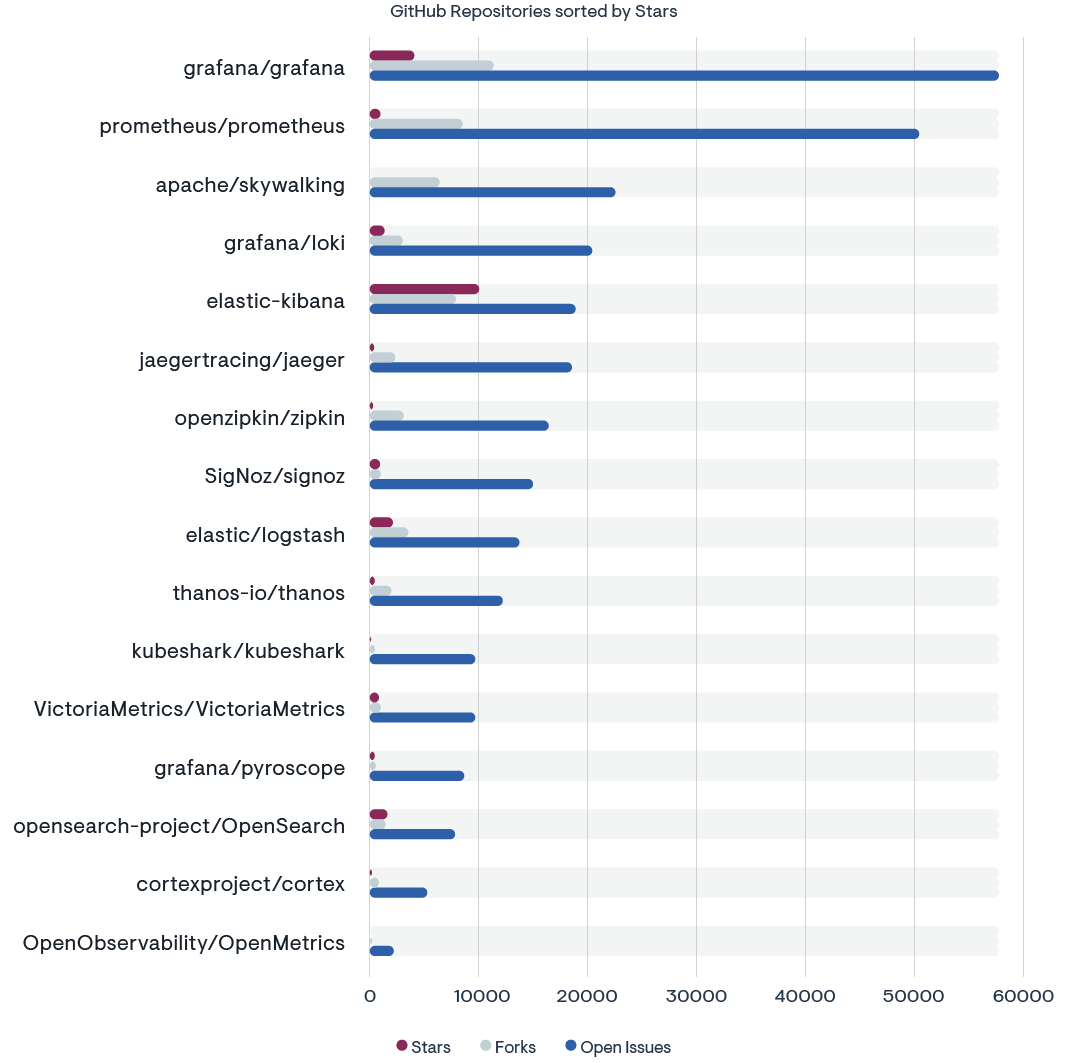
Grafana (dashboards), Prometheus (Kubernetes metrics), and Apache Skywalking (application performance monitoring for microservices) are the top three most prominent GitHub repositories related to OpenTelemetry, with Grafana’s Loki (log management), Elastic Kibana, and Jaeger following suit.
Grafana dashboards and OpenTelemetry
Grafana and OpenTelemetry have a symbiotic relationship that is crucial for modern observability practices. Grafana is a popular open source platform for monitoring and observability that allows users to create dashboards and visualizations for their data. OpenTelemetry, on the other hand, is a set of APIs, SDKs, tooling, and integrations that are designed to create and manage telemetry data (metrics, logs, and traces) for cloud native software.
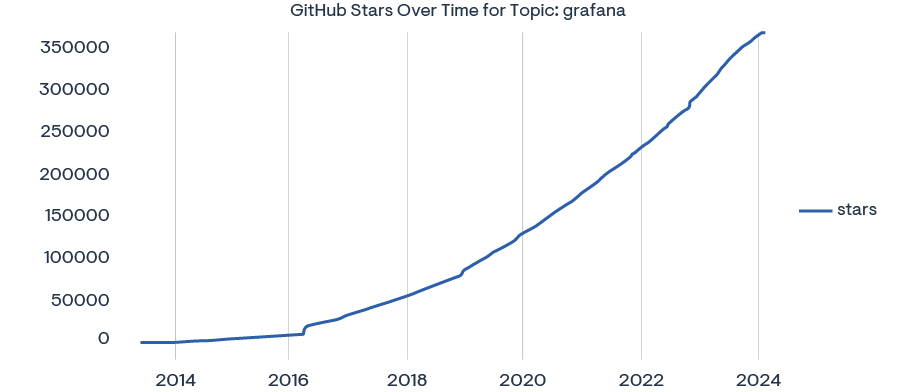
The relationship between the two is centered around the use of OpenTelemetry to collect telemetry data from various sources and Grafana’s ability to visualize that data. OpenTelemetry provides a unified way to gather telemetry data across different services and platforms, which can then be exported to various backends, including Grafana, for analysis and visualization. This integration allows developers and operators to gain insights into their systems, troubleshoot issues, and ensure their applications are running optimally.
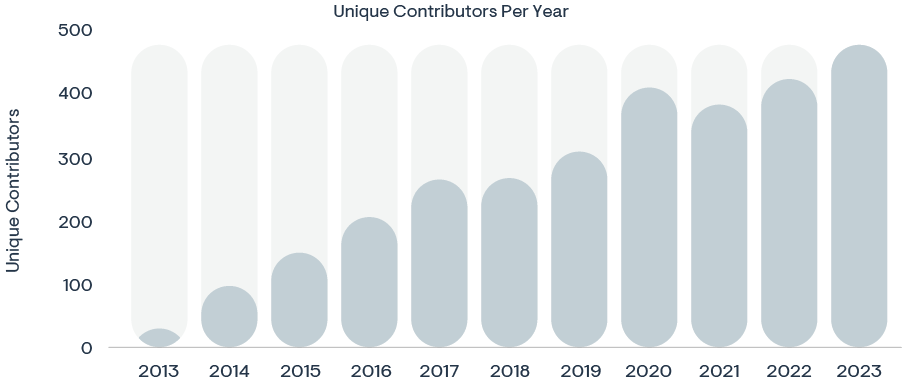
Moreover, the integration is important because it supports a wide range of observability use cases. For instance, Grafana can display metrics that OpenTelemetry collected, allowing users to monitor the performance of their applications. It can also visualize traces, which helps in understanding the flow of requests through a system and identifying bottlenecks. Additionally, Grafana can be used to explore logs collected by OpenTelemetry, making it easier to correlate logs with metrics and traces for a comprehensive view of system health.
In summary, the relationship between Grafana and OpenTelemetry is important because it enables a powerful and flexible observability stack that can adapt to the complex and dynamic nature of cloud native environments. Grafana’s visualization capabilities, combined with OpenTelemetry’s comprehensive data collection framework, provide a robust solution for monitoring, troubleshooting, and optimizing modern software systems.
OpenTelemetry development priorities: 6 key themes
Clustering all 1,369 GitHub issues created over the past 12 month period, we find six key topics:
- Tracing
- Prometheus
- SDK
- Kafka
- Metadata
- Kubernetes
Top 6 OpenTelemetry development priorities on GitHub
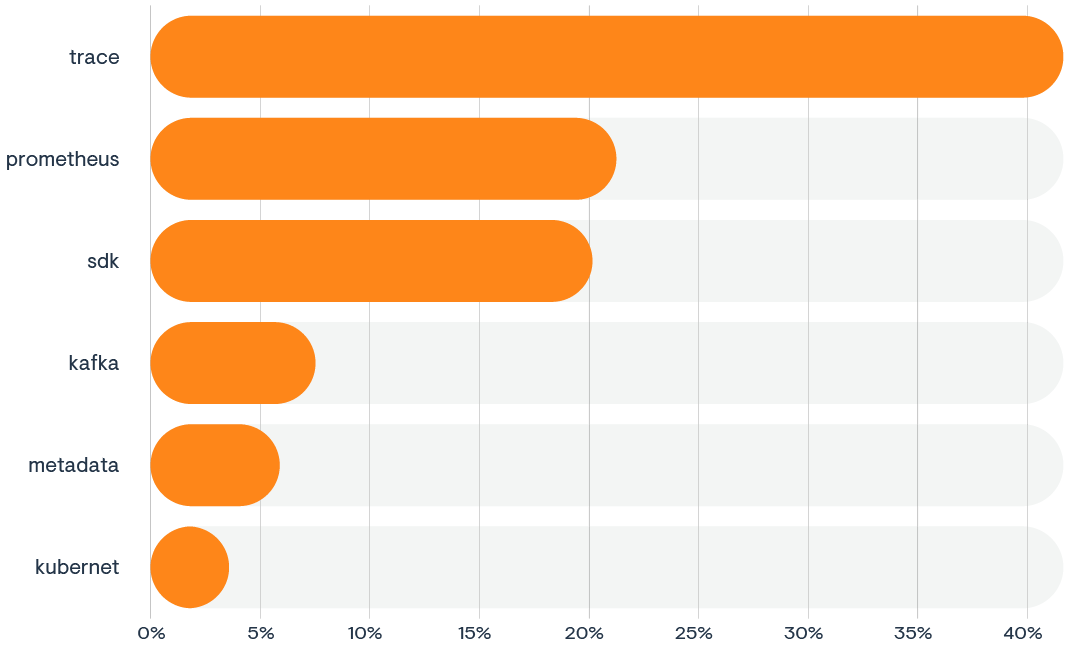
In the following, we will drill into each one of these topic areas based on a complete analysis of the title and text of all relevant GitHub issues to determine their key areas of focus.
OpenTelemetry tracing: development priorities
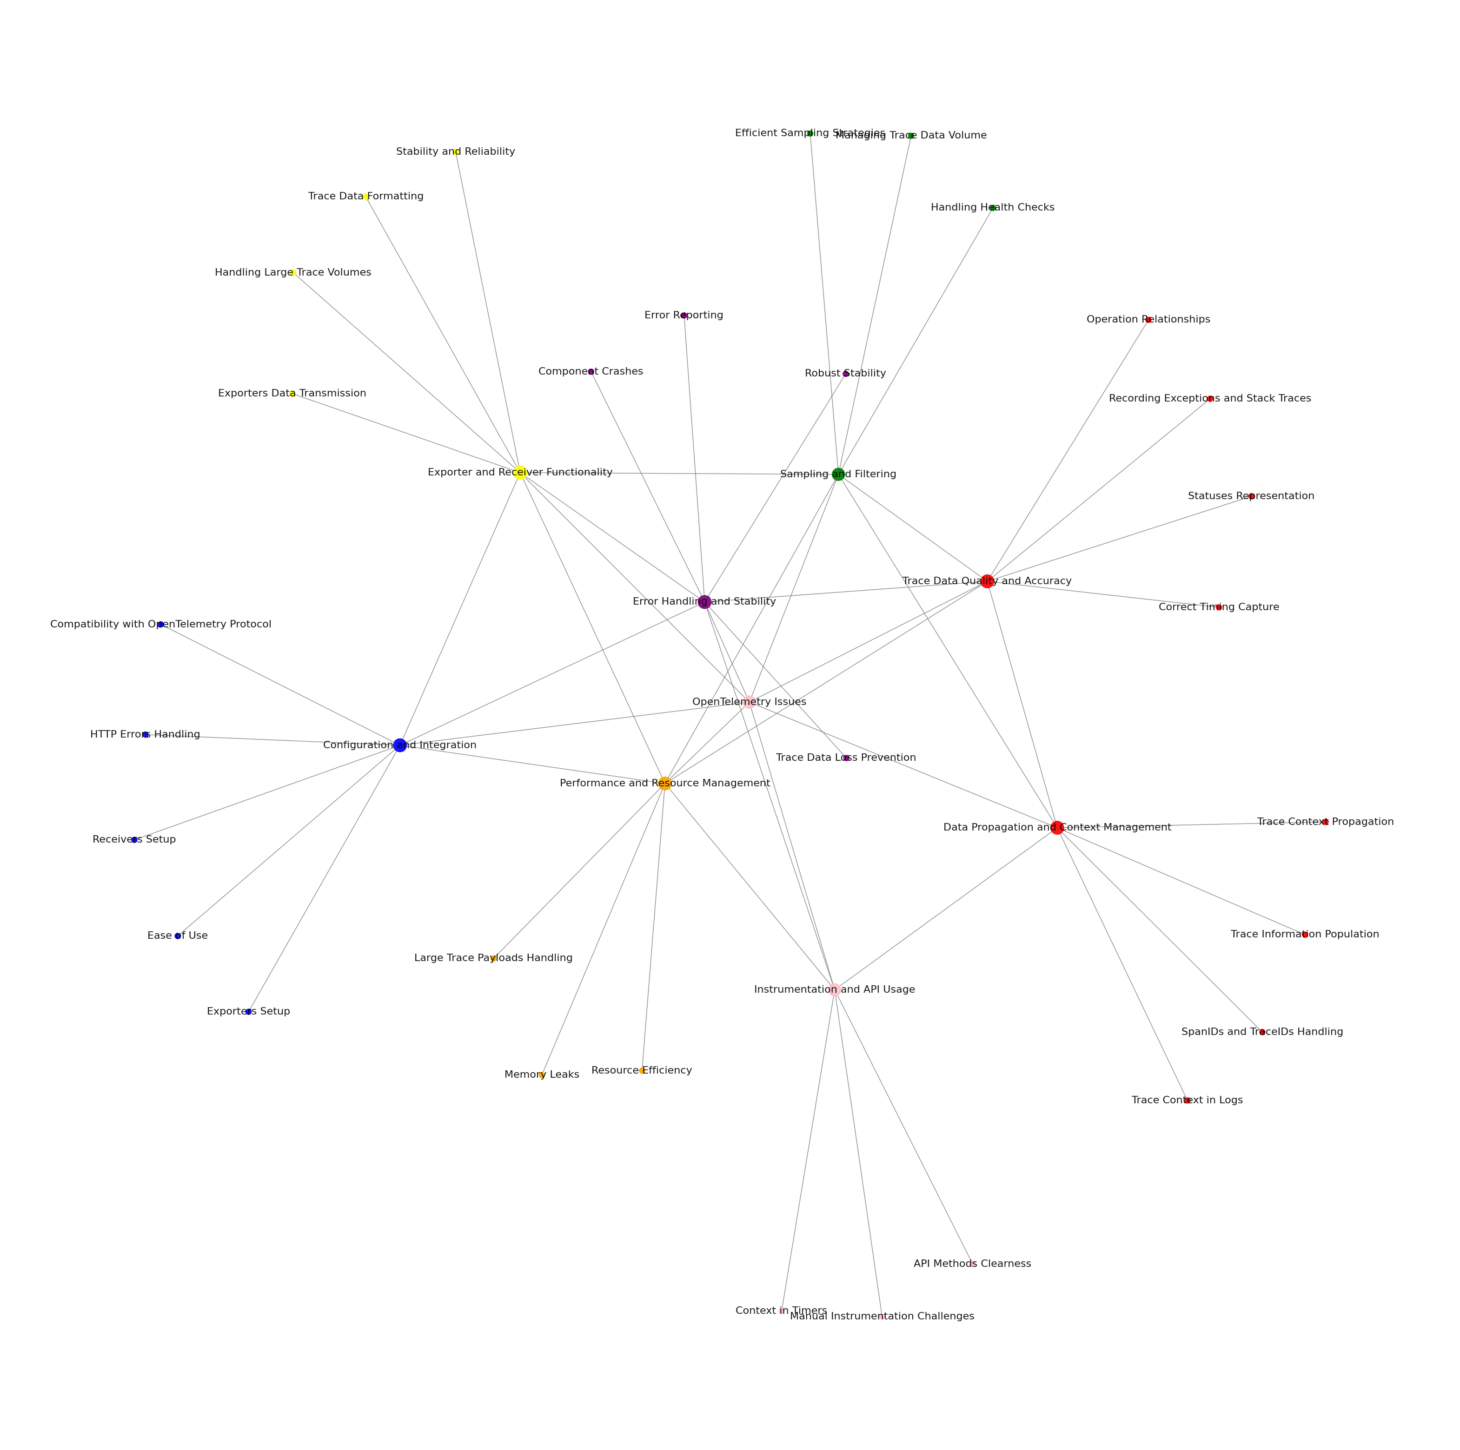
Configuration and integration
Many issues revolve around the configuration and integration of tracing with various systems and protocols. This includes handling of specific HTTP errors, setting up exporters and receivers correctly, and ensuring compatibility with different versions of the OpenTelemetry protocol. Ultimately, OpenTelemetry developers aim for tracing to work seamlessly across different platforms and services.
Data propagation and context management
Issues in this category focus on the propagation of trace context across microservices, handling of SpanIDs and TraceIDs, and ensuring that trace context is correctly maintained throughout different parts of the system. This also includes concerns about the correct handling of trace context in logs and ensuring that trace information is correctly populated and propagated.
Sampling and filtering
There are challenges related to sampling and filtering of trace data, such as implementing efficient sampling strategies, handling health checks differently from other traces, and managing the volume of trace data through selective sampling. Developers are seeking solutions that allow capturing the most relevant trace data without overwhelming the underlying systems.
Exporter and receiver functionality
Problems with exporter and receiver functionality include issues with specific exporters not sending trace data correctly, handling large volumes of trace data, and ensuring that trace data is correctly formatted and transmitted. There are also efforts to enhance the stability and reliability of exporters and receivers, especially in high-throughput environments.
Performance and resource management
Performance-related issues include memory leaks, handling of large trace payloads, and the efficient use of resources when processing and exporting trace data. Developers are looking for optimizations that can reduce the overhead of tracing on their systems and improve the overall performance of their monitoring setup.
Error handling and stability
This theme includes various errors and crashes reported in different components of the tracing system, often related to specific configurations or edge cases. Developers are working on better error handling, clearer error messages, and more robust stability to prevent trace data loss and ensure reliable operation.
Instrumentation and API usage
Issues related to instrumentation and API usage include challenges with manual instrumentation, the behavior of context and trace in the presence of timers, and the use of API methods that may not be intuitive or well-documented. Developers are working on improvements in the API to make instrumentation more straightforward and less error-prone.
Trace data quality and accuracy
Concerns about trace data quality and accuracy involve ensuring that trace data reflects the correct timing, relationships, and statuses of operations within a system. This includes handling of trace IDs and span IDs, recording exceptions and stack traces accurately, and ensuring that trace data is complete and informative.
These themes represent a broad range of technical challenges and feature requests that are encountered when integrating tracing with OpenTelemetry. Addressing these issues is crucial for the development of a robust, efficient, and user-friendly tracing system that can operate effectively in diverse environments.
OpenTelemetry and Prometheus: development priorities
Compatibility and specification
Issues in this category primarily focus on ensuring that the Prometheus exporter aligns with the OpenTelemetry specification and compatibility guidelines. This includes challenges related to metric names, labels, types, and the overall stability and clarity of the Prometheus compatibility specification. The goal is to achieve seamless integration and interoperability between Prometheus and OpenTelemetry, adhering to established standards and practices.
Configuration and customization
Configuration and customization issues revolve around the difficulties encountered when setting up and customizing Prometheus receivers or exporters. Users seek more flexibility in configuring options, such as feature toggling, batch sizes, headers, and handling multiple instances within the same environment. Enhancing configurability would allow for better adaptation to specific use cases and operational requirements.
Exporter and receiver functionality
This theme captures problems with the functionality of Prometheus exporters and receivers, including metric type support, exemplar support, and data model conversions. Additionally, there are issues with the Prometheus remote write exporter, such as handling large requests, retry logic, and error handling. Improving these aspects is crucial for efficient and reliable metric collection and forwarding.
Performance and resource management
Performance and resource management issues are characterized by high memory usage, potential memory leaks, and inefficiencies in memory use during metric conversion processes. Addressing these concerns is essential for optimizing the performance and scalability of Prometheus integration within the OpenTelemetry ecosystem, especially in resource-constrained environments.
Data accuracy and integrity
Concerns about data accuracy and integrity include incorrect handling of metric temporality and aggregation, leading to inaccurate metric data. There are also issues with metric labels and naming conventions, as well as problems with the scraping process, such as handling histograms without buckets or summary metrics without quantiles. Ensuring the accuracy and integrity of metric data is fundamental for reliable monitoring and analysis.
Observability and debugging
Enhanced logging and debugging capabilities are requested to better trace and understand the behavior of Prometheus components. This includes issues with the visibility of exemplar data and the need for better support for exemplars in the Prometheus exporter. Improved observability and debugging tools would aid in diagnosing and resolving issues more efficiently.
Deployment and operation
Deployment and operation challenges include setting up and operating Prometheus receivers in specific environments, such as Kubernetes or serverless platforms. There are also issues related to service discovery and dynamic scrape configurations. Streamlining deployment and operation processes would facilitate smoother integration and management of Prometheus within diverse infrastructures.
Error handling and stability
This theme encompasses various errors and crashes reported in different components of the Prometheus exporter and receiver, often related to specific software versions or configurations. There are also concerns about the stability and reliability of Prometheus-related components, with calls for better error handling and fallback mechanisms. Enhancing error handling and stability is critical for building robust and dependable monitoring solutions.
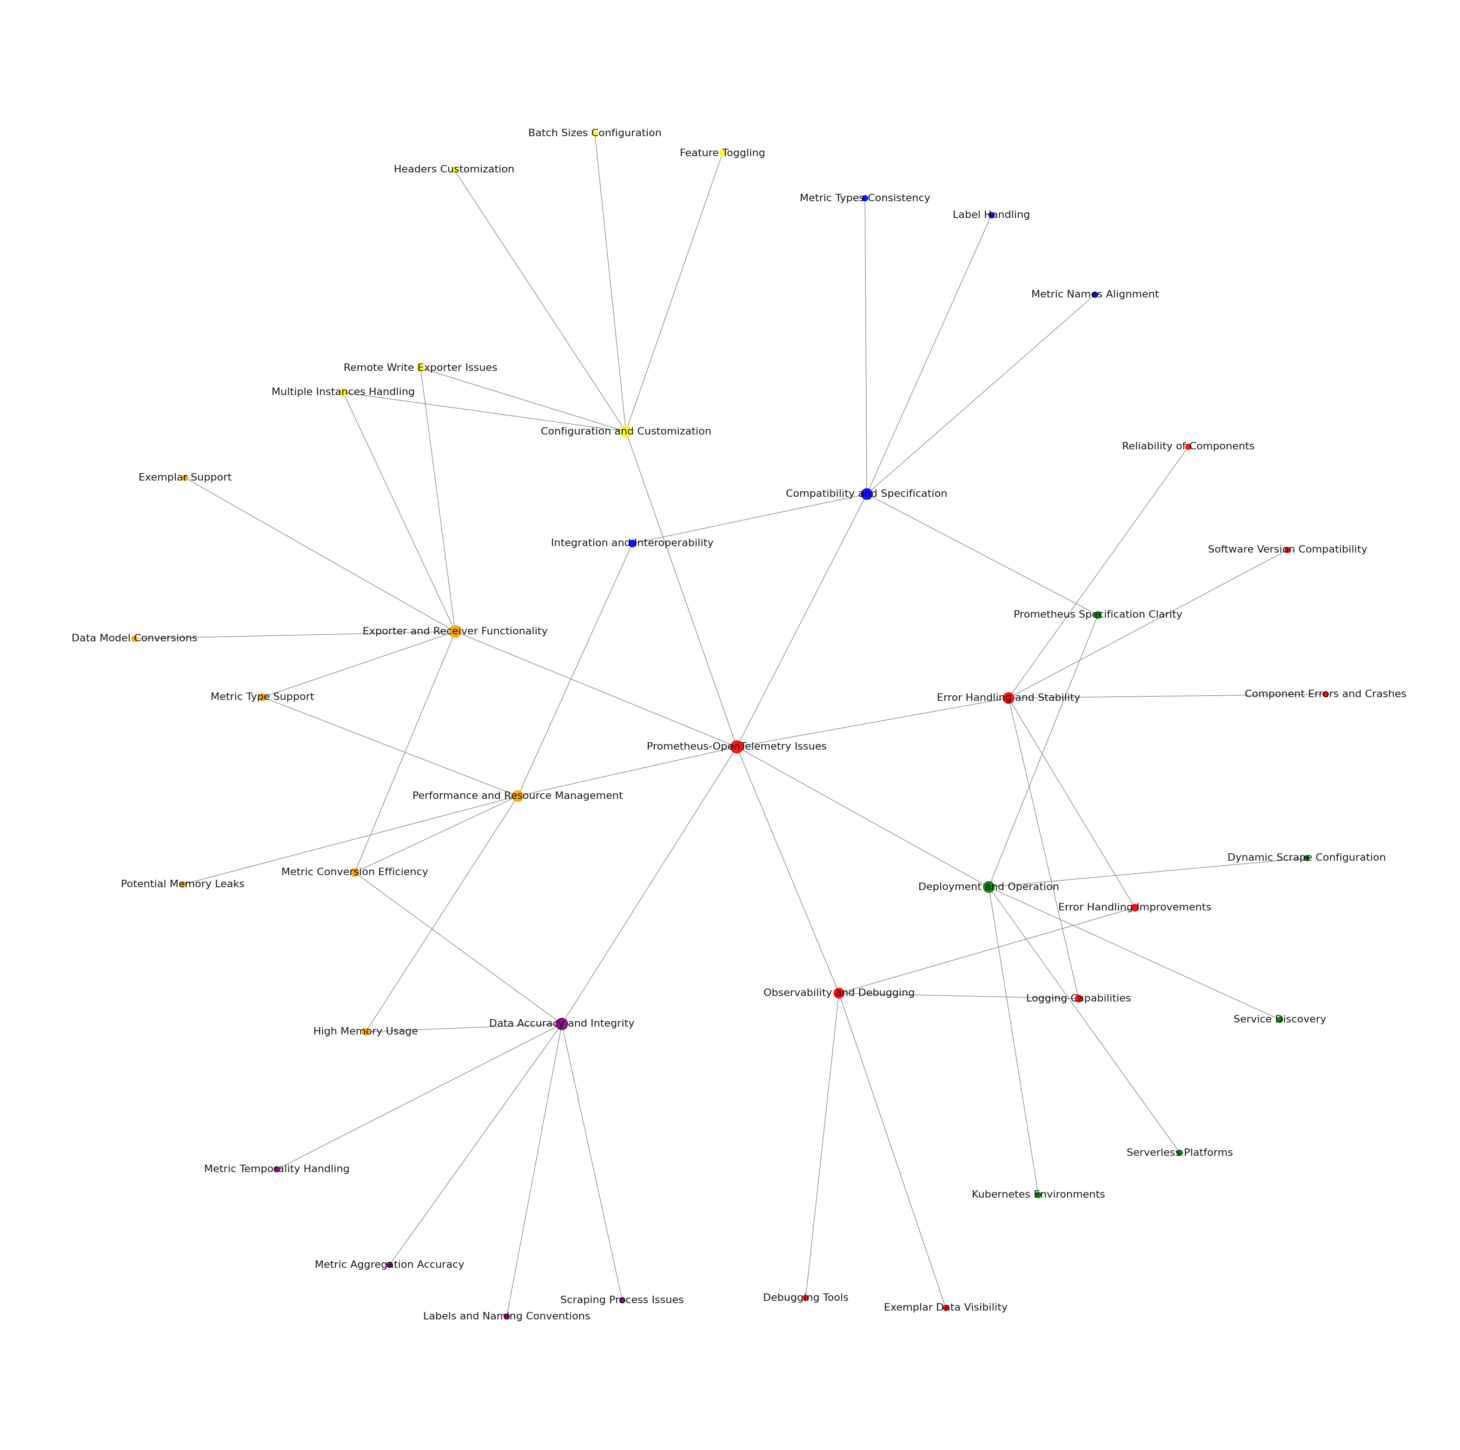
These themes collectively represent the spectrum of technical challenges and feature requests encountered in the integration of Prometheus with OpenTelemetry. Addressing these issues is key to advancing the compatibility, performance, and usability of Prometheus within the OpenTelemetry ecosystem across a wide range of deployment scenarios.
OpenTelemetry and SDKs: development priorities
Metric SDK specification compliance
Issues in this theme are related to verifying that the implementation of the metric SDK adheres to the OpenTelemetry specification. This includes ensuring that various components, such as MetricExporter, MetricProducer, MetricReader, and their operations like Collect, RegisterProducer, and Shutdown, are implemented correctly.
SDK configuration and extension
This theme encompasses issues related to the configuration and extension of the SDK. It includes the ability to configure MetricExporters, add support for logs, handle environment variables, and extend the SDK with additional features like HostDetector or custom filters for metrics.
SDK instrumentation and exporters
Issues here involve the instrumentation and exporter components of the SDK. This includes upgrading dependencies for various exporters, handling metadata, and ensuring compatibility with different versions of the SDK. It also covers the integration of the SDK with other services like AWS, Alibaba Cloud, and Azure.
SDK errors and compatibility
This theme includes issues that arise from SDK updates that break existing functionality, such as the http instrumentation issue with version 0.35.1 of @opentelemetry/sdk-node. It also covers compatibility concerns with other OpenTelemetry implementations and the handling of errors and exceptions within the SDK.
SDK performance and resource management
Issues in this cluster deal with the performance of the SDK, including benchmarking, handling of SDK internal state metrics, and resource management, like the handling of shutdown methods and stress testing.
SDK logs and tracing
This theme includes issues related to the logging and tracing capabilities of the SDK, such as the inclusion of trace context in logs, the handling of log record processors, and the configuration of the LoggerProvider and TracerProvider.
SDK metrics and views
Issues related to the metrics data model, handling of NaN values, and the configuration of views and aggregations fall under this theme. It also includes the handling of metric instruments and the implementation of cardinality limits.
SDK stability and lifecycle
This theme covers issues related to the stability and lifecycle of the SDK, including the planning for SDK 2.0, regular release cadence, and the consolidation of SDK configuration. It also includes the handling of critical logs and the removal of dependencies to make the SDK more modular.
Cross-cutting concerns and best practices
Issues that span multiple areas of the SDK, such as the handling of environment variables to align with other OpenTelemetry SDKs, the adoption of W3C Trace Context Level 2 spec, and the consideration of design improvements for internal state metrics, are included in this theme.
Cluster and multi-process support
This theme includes issues related to the use of the SDK in a clustered environment or with multiple processes, such as the challenge of metric collection and export in Node.js cluster mode.
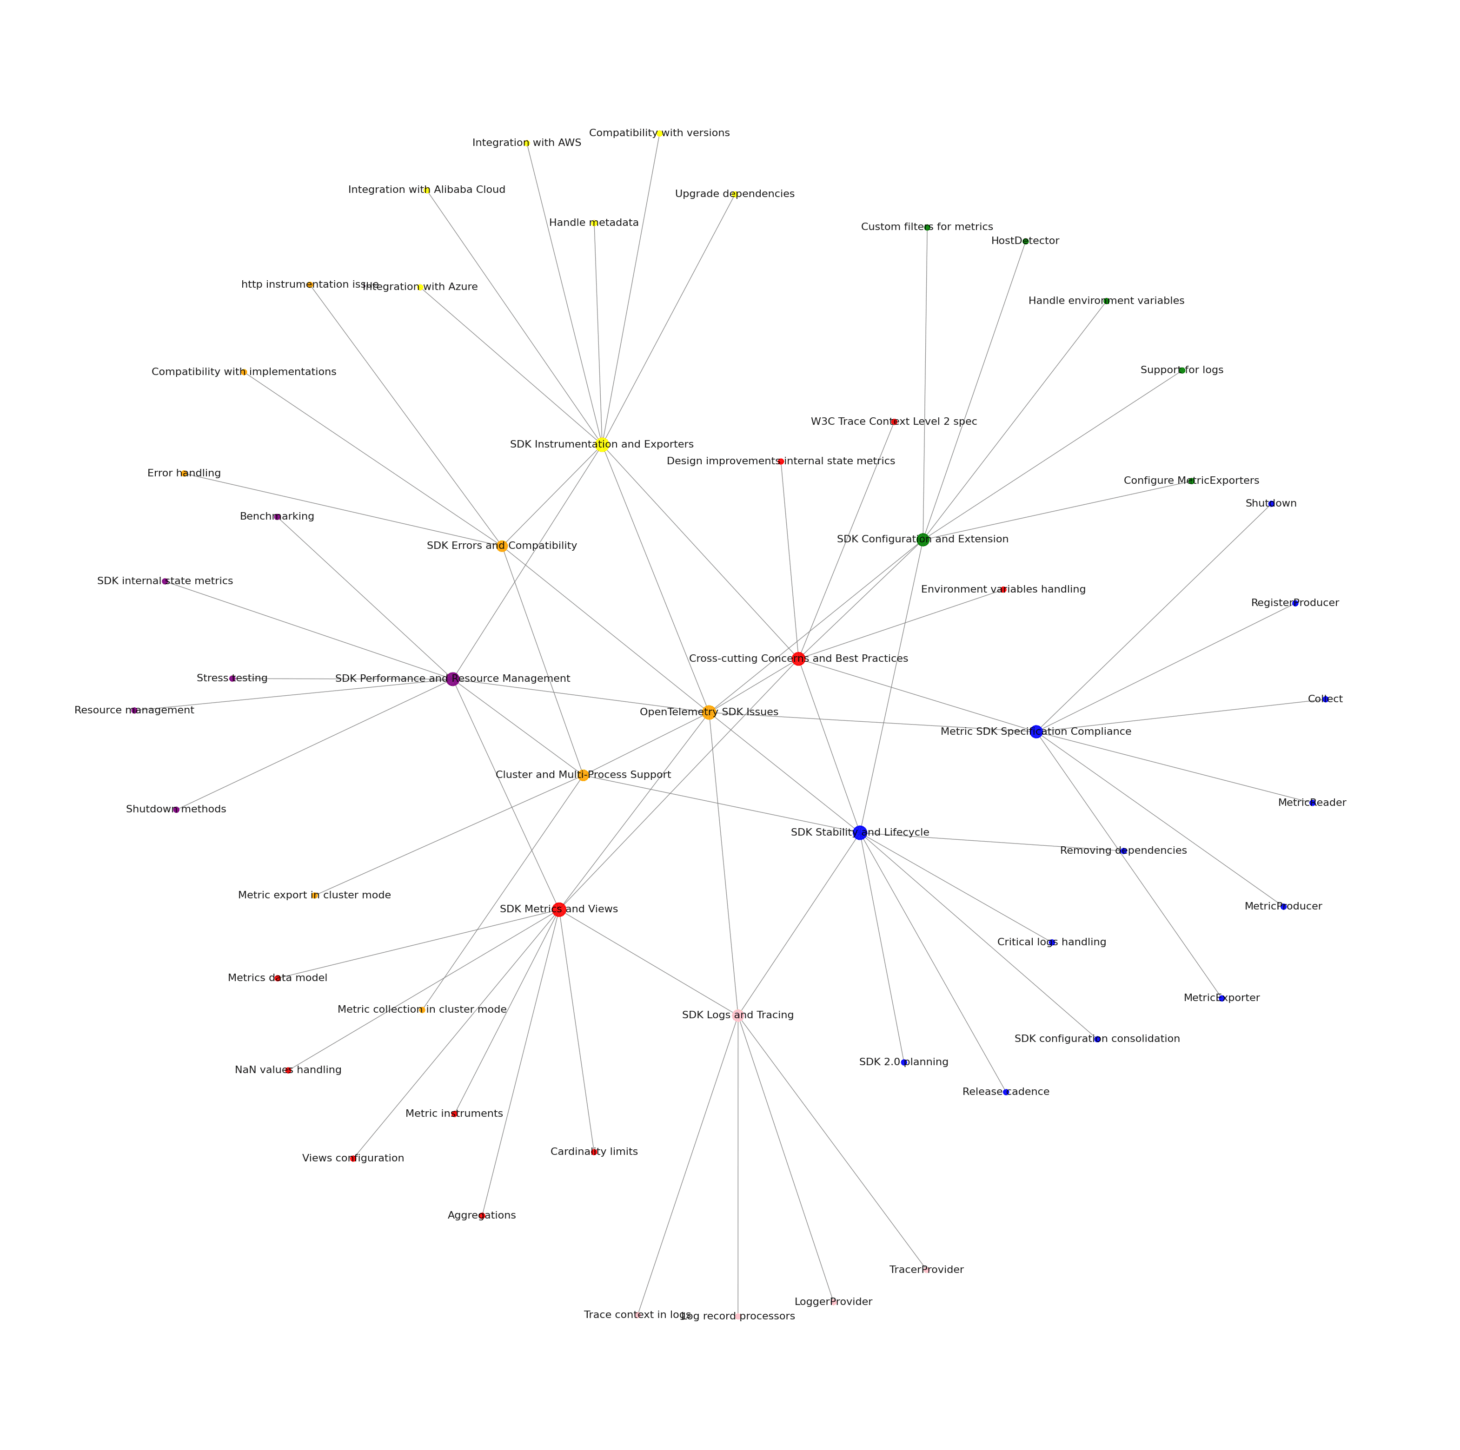
Each theme represents a distinct area of focus for OpenTelemetry SDK development and maintenance, reflecting the complexity and breadth of the project’s goals to provide a comprehensive observability framework.
Kafka and OpenTelemetry: development priorities
Challenges with Kafka Exporter
The Kafka exporter component of OpenTelemetry is facing a series of issues. These problems range from setting up the system (configuration), verifying users and systems (authentication), to handling and processing data (message handling). They also include the need to support various communication protocols and data formats (protocols and encodings).
Difficulties with Kafka Receiver
The Kafka receiver component, responsible for receiving and interpreting data, has its own set of challenges. These include processing and understanding data (message consumption), handling additional information (metadata support), managing inactive sessions (session timeout configurations), and supporting various data formats (log formats and encodings).
Authentication and security concerns
Security is a critical aspect of any system, and Kafka in OpenTelemetry is no exception. There are issues related to user and system verification (SASL configuration), handling sensitive data (encrypted TLS keys), and managing trusted entities (keystore and truststore authentication).
Configuration and optimization problems
Optimizing the performance of Kafka in OpenTelemetry is a challenge. This includes filtering unnecessary data (message filtering), improving data processing speed (consumption speed), and managing unique identifiers and data distribution (client IDs and partition keys).
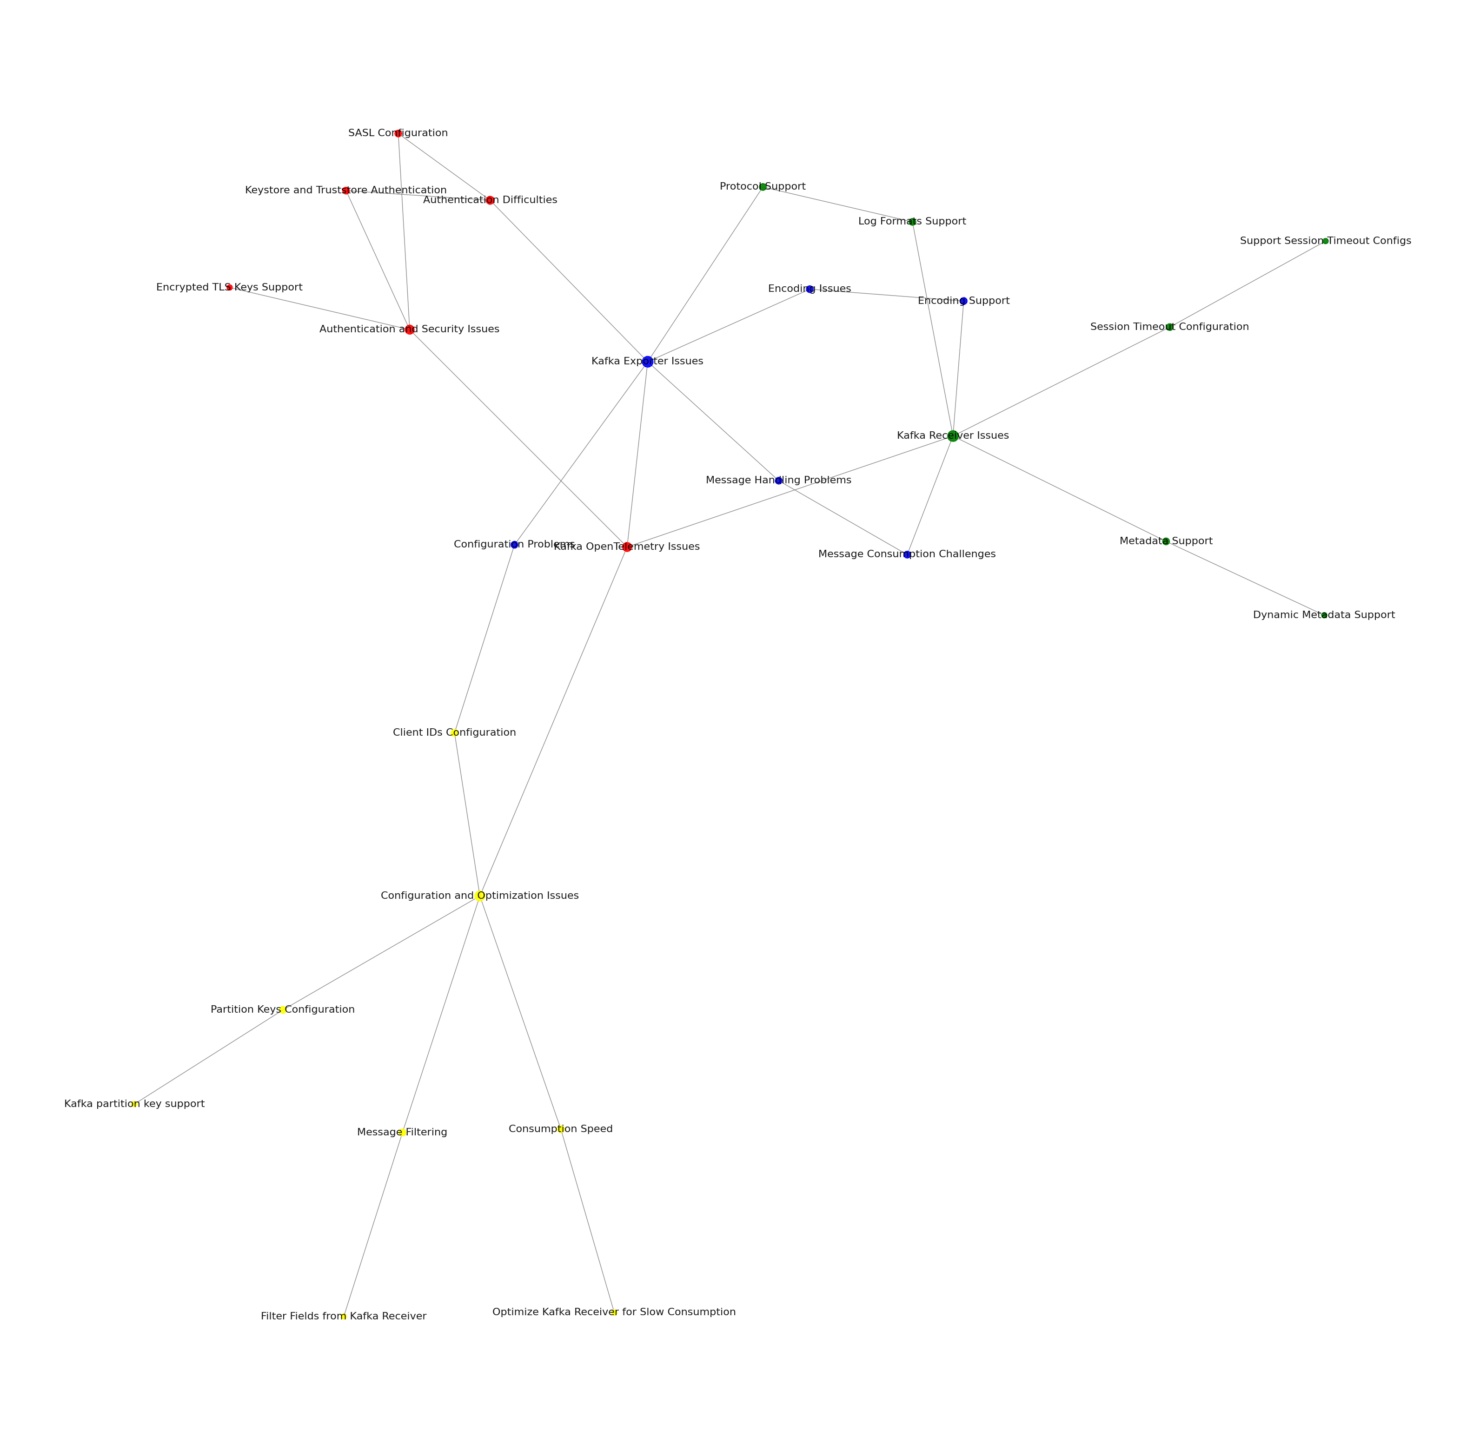
In summary, these themes provide a high-level view of the various challenges companies face in integrating Kafka with OpenTelemetry. They highlight the areas that need attention to improve the user and developer experience.
OpenTelemetry metadata: development priorities
Tooling and CI/CD integration
This category includes issues related to the development tools and continuous integration/continuous deployment (CI/CD) processes that support metadata handling in OpenTelemetry. Issues in this category focus on enhancing the developer experience and ensuring the reliability of metadata-related features through better tooling and integration with CI/CD pipelines.
Metadata schema and documentation
This category includes issues that deal with defining, documenting, and enhancing the schema for metadata, as well as improving the documentation for how metadata should be used within OpenTelemetry components. These issues aim to clarify and standardize how metadata is defined and used across OpenTelemetry, making it easier for developers to implement and utilize metadata consistently.
Metadata in exporters and receivers
This category encompasses issues related to the handling and utilization of metadata in various exporters and receivers within the OpenTelemetry ecosystem. Issues in this category focus on improving the capture, transmission, and utilization of metadata in the context of exporting and receiving telemetry data, enhancing the observability and traceability of applications.
Kubernetes and container metadata
This category includes issues related to the extraction and utilization of metadata in Kubernetes environments and containerized applications. These issues aim to improve the integration of OpenTelemetry with Kubernetes and container technologies, enabling better observability and monitoring of containerized applications through enriched metadata.
Metadata handling and processing
This category covers issues related to the general handling, processing, and enhancement of metadata within the OpenTelemetry framework. Issues in this category focus on the mechanisms and features within OpenTelemetry that support the processing and handling of metadata, aiming to improve the flexibility, efficiency, and capabilities of metadata management.
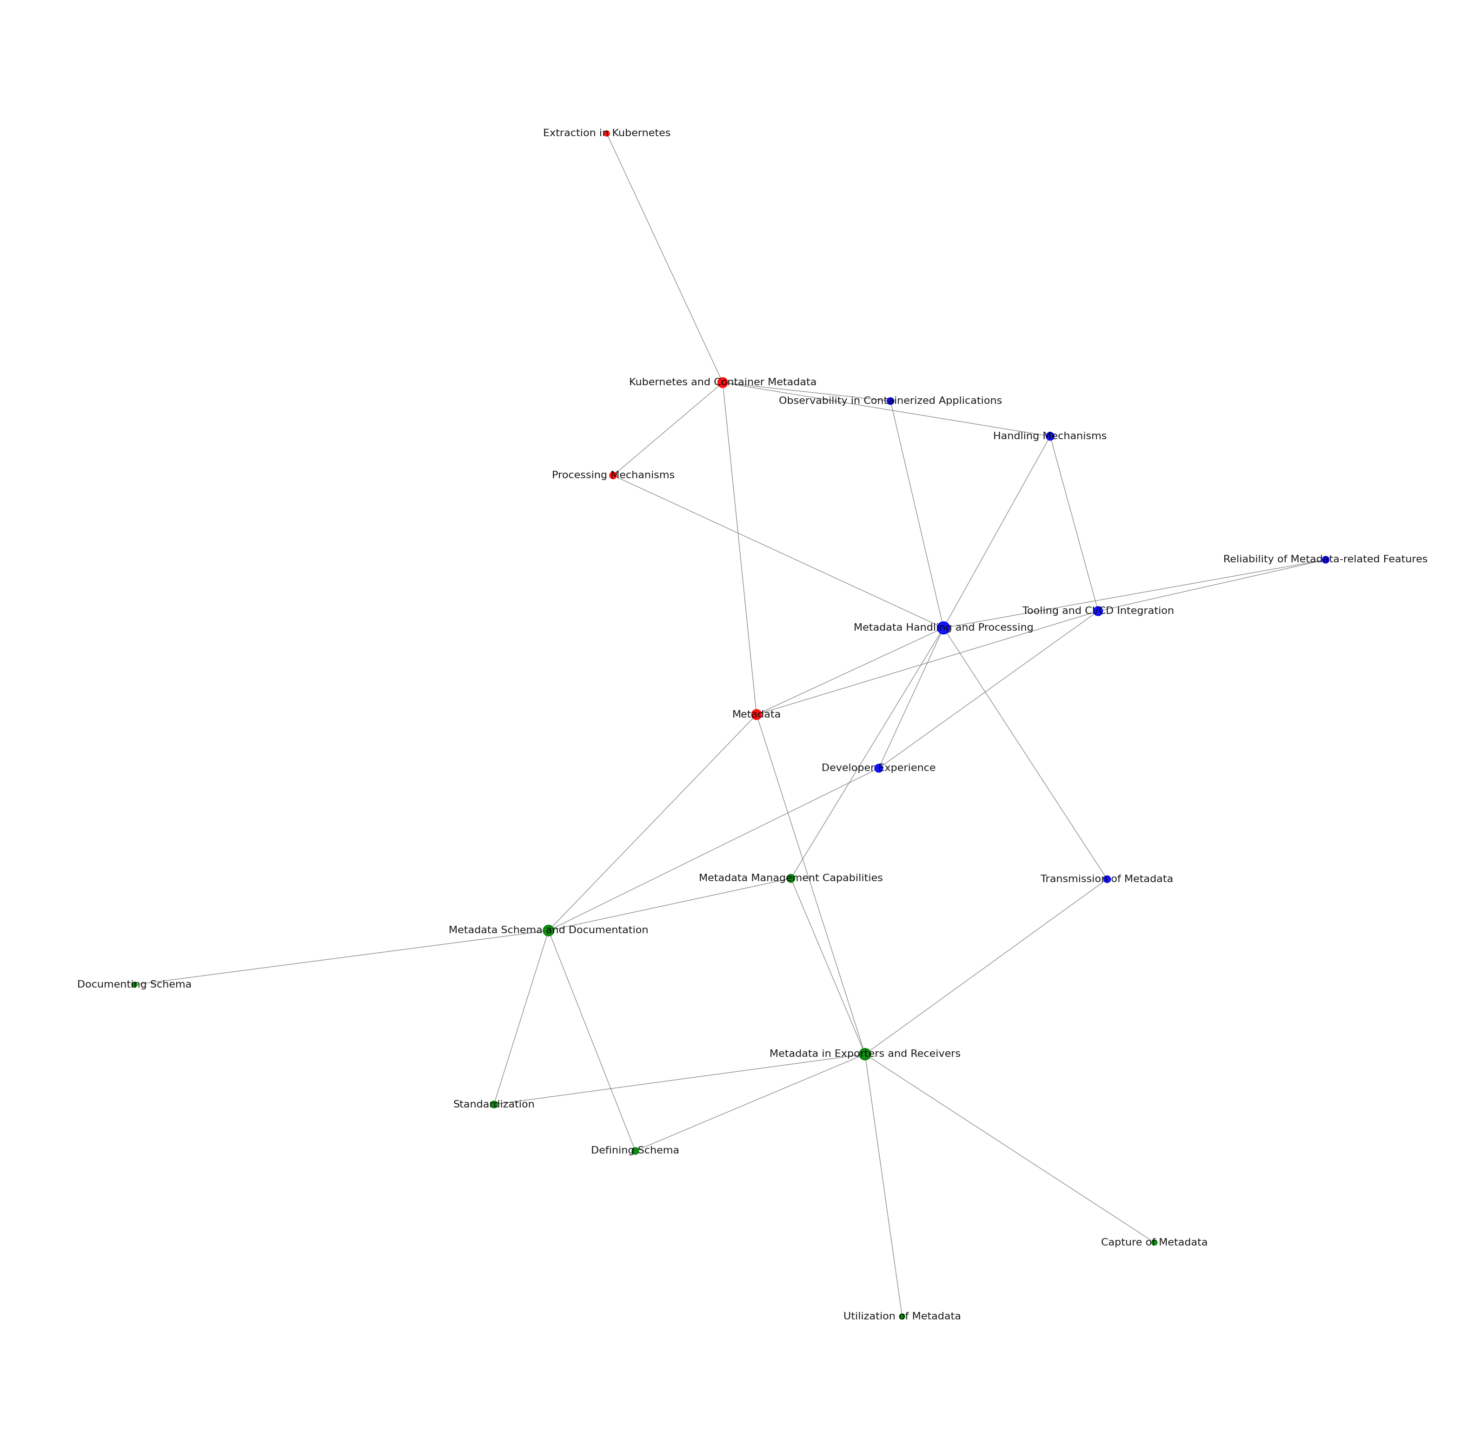
In summary, OpenTelemetry is actively working to improve metadata handling across its ecosystem, focusing on enhancing developer tools, standardizing metadata schemas, improving data capture and transmission, integrating with Kubernetes and container technologies, and refining metadata processing capabilities.
Kubernetes and OpenTelemetry: development priorities
OpenTelemetry, a robust framework for monitoring Kubernetes environments, is being actively developed to address various challenges and enhance its functionality. Here’s a high-level summary of the key areas of focus:
Testing and compatibility
Efforts are being made to ensure OpenTelemetry’s compatibility with different Kubernetes versions. This involves running tests across various versions to ensure seamless integration and performance.
Receiver functionality
OpenTelemetry receivers, which collect data from Kubernetes, are being updated to support new features and versions of Kubernetes. This ensures that OpenTelemetry can effectively gather and process data from the latest Kubernetes environments.
Leader election support
To prevent data duplication, OpenTelemetry is working on supporting Kubernetes leader election. This feature will help streamline data collection and improve efficiency.
Feature enhancements
OpenTelemetry is constantly evolving, with new feature requests made to improve its Kubernetes support. These enhancements aim to increase the scope and effectiveness of OpenTelemetry’s monitoring capabilities.
Configuration and authentication
OpenTelemetry is working on improving its configuration and authentication processes within Kubernetes environments. This includes leveraging Kubernetes service account JWTs for authentication, which can enhance security and ease of use.
Log collection
OpenTelemetry is focusing on improving the experience of collecting logs from Kubernetes. This will provide more detailed and useful information for monitoring and troubleshooting.
Flaky tests
OpenTelemetry is addressing issues with inconsistent test results to ensure the reliability of its features and functionalities.
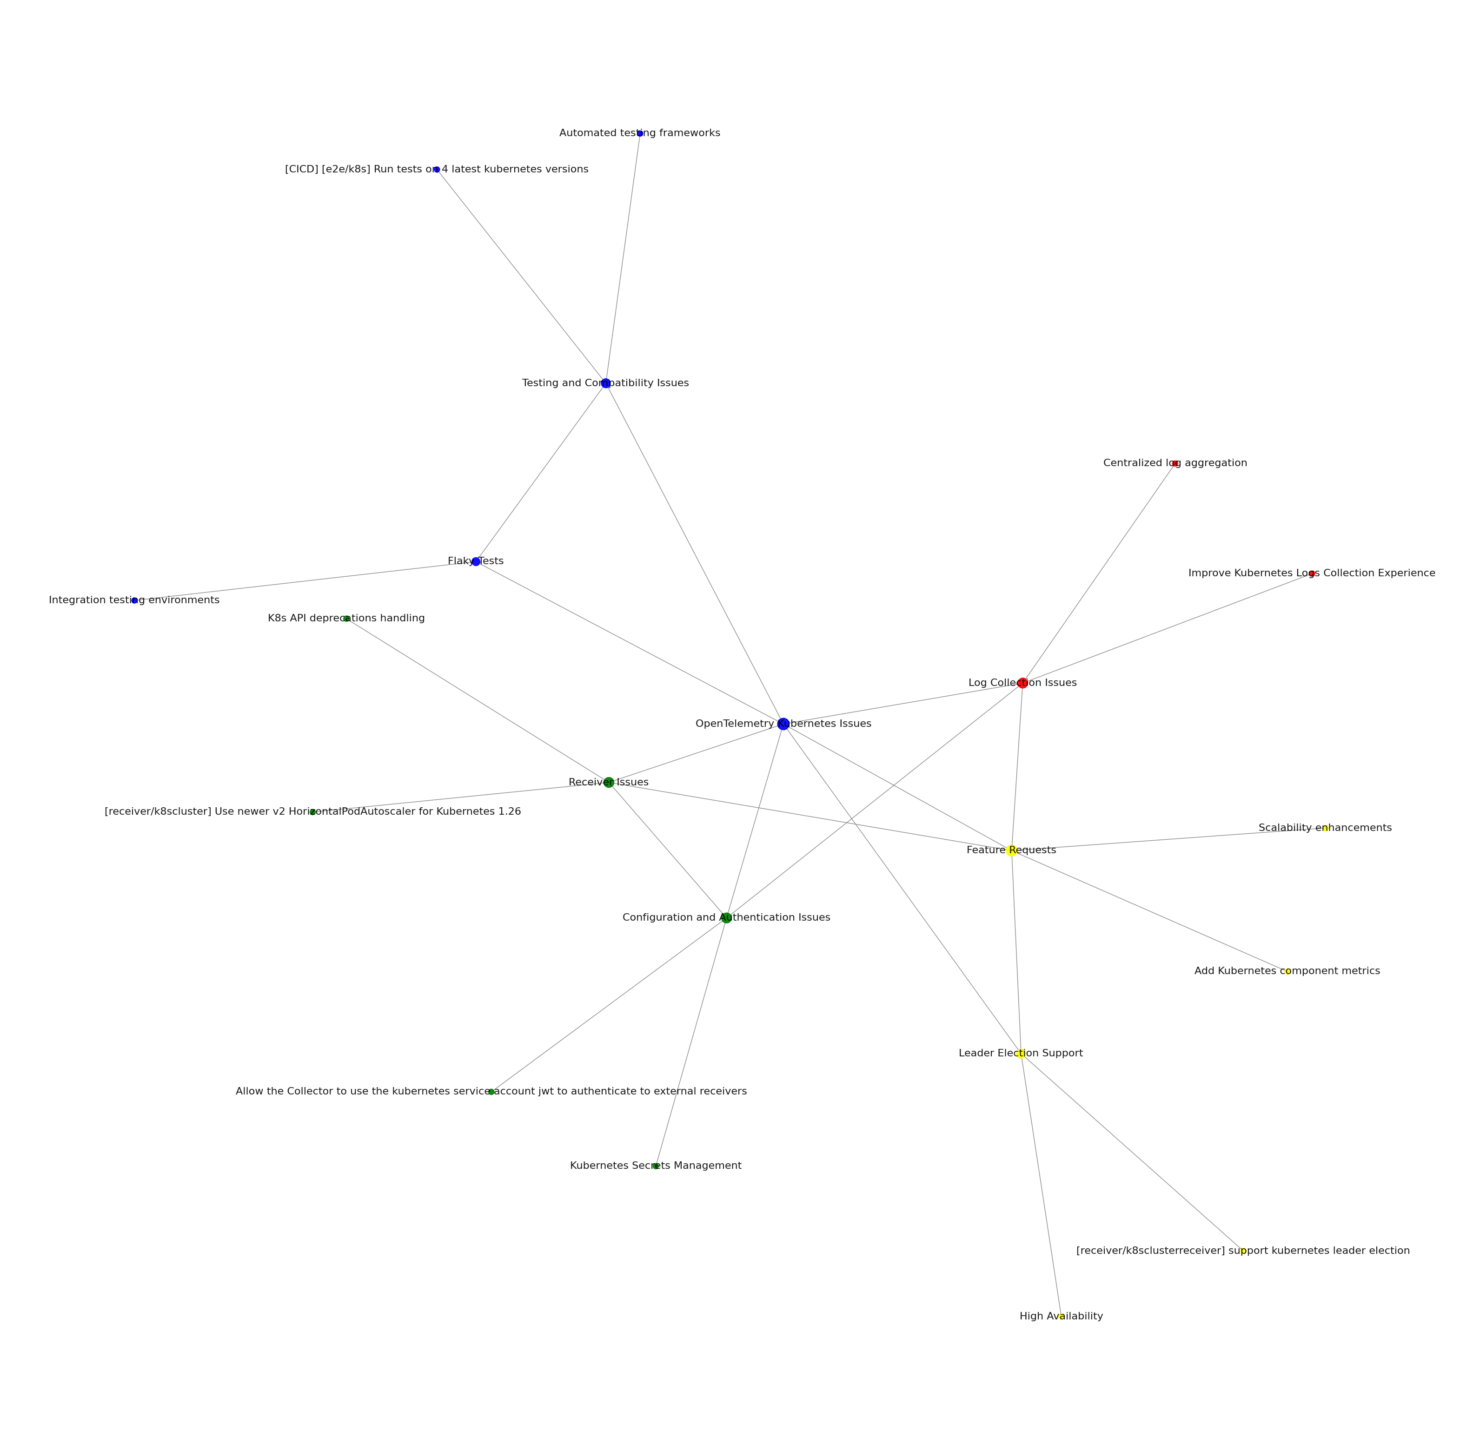
In summary, OpenTelemetry is actively addressing a range of issues to enhance its Kubernetes support. These improvements aim to provide more robust, efficient, and user-friendly monitoring for Kubernetes environments, thereby helping tech-savvy individuals better understand and manage their Kubernetes deployments.
OpenTelemetry priorities on GitHub: summary
The OpenTelemetry project is strategically enhancing its observability framework to address critical areas across Kubernetes, metadata management, Kafka integration, SDK development, Prometheus compatibility, and tracing capabilities. This holistic approach is designed to refine interoperability, extend functionality, and improve the reliability and usability of the OpenTelemetry ecosystem. By focusing on testing and compatibility across Kubernetes versions, enriching metadata handling, and resolving Kafka-related challenges, OpenTelemetry aims to ensure a seamless and efficient observability experience. These efforts emphasize the importance of robust testing frameworks, advanced feature sets, and improved configuration and authentication mechanisms to support the dynamic requirements of modern, cloud native applications.
In parallel, the project is dedicated to advancing its SDK by ensuring compliance with specifications, enhancing configuration options, and improving performance and resource management. This is complemented by efforts to bolster Prometheus integration through addressing compatibility issues, optimizing performance, and ensuring data accuracy. Additionally, the initiative to enhance tracing functionalities focuses on improving data propagation, sampling strategies, and exporter performance. Collectively, these priorities demonstrate OpenTelemetry’s commitment to delivering a comprehensive, scalable, and user-friendly observability framework. By tackling these diverse yet interconnected challenges, OpenTelemetry is positioning itself as a pivotal tool for developers and organizations aiming to achieve higher levels of visibility, reliability, and operational efficiency in their software environments.
