Tool overload
is real
101
different observability technologies
cited as being currently in use
Observability runs
on OSS
71%
of organizations say they’re using
Prometheus and OpenTelemetry in
some capacity†
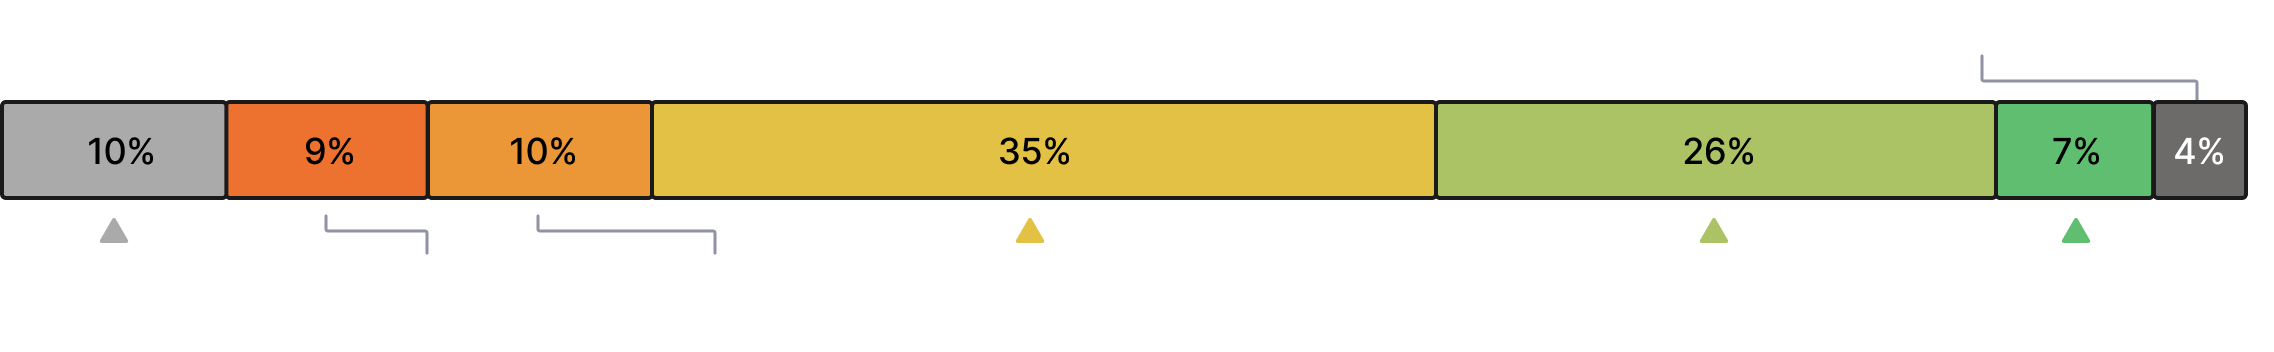
Cost dominates buying
decisions
74%
say it’s a top priority for selecting
tools, ahead of ease of use and
interoperability
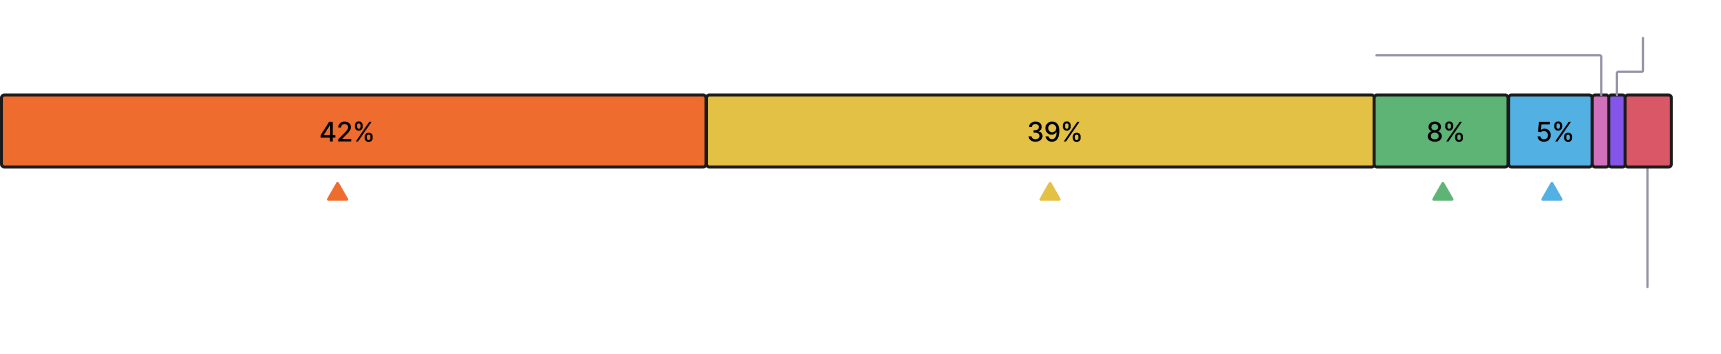
Complexity
chaos
39%
say complexity/overhead is their
biggest observability obstacle—the
most frequently cited impediment
Full stack to
the fore
85%
of companies are using unified
infrastructure and application
observability in some capacity†
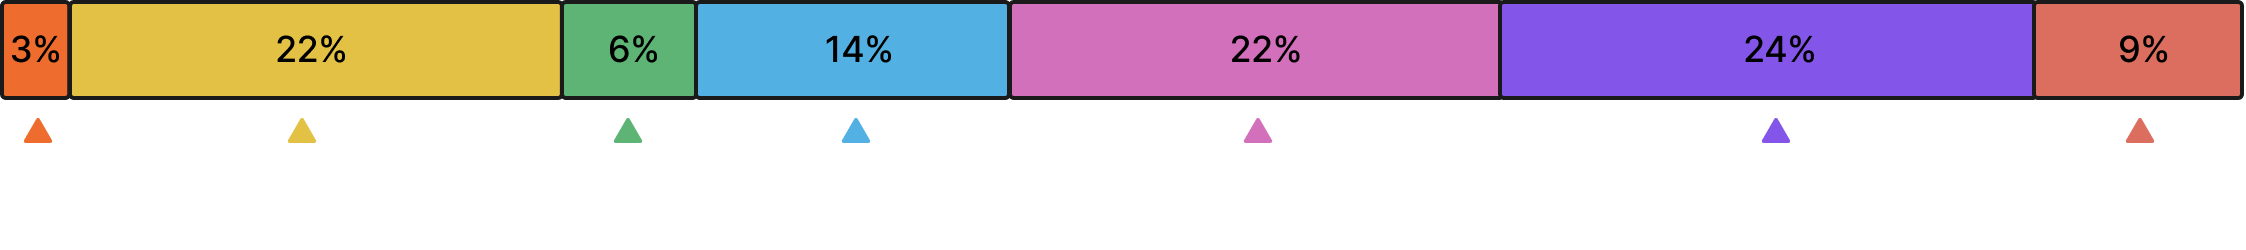
A view from
the top
49%
say the “CTO/C-level” or “VP-level”
is the highest level at which
observability is considered
critical to the business