
What is Grafana Alerting?
Grafana Alerting allows you to alert on your metrics and logs, no matter where they are stored. Create, manage, and take action on your alerts in a single, consolidated view, and improve your team’s ability to identify and resolve issues quickly.
No blind spots in your architecture
Create alerts from any data source to ensure every part of your service, infrastructure, and product is monitored and alerted on — all using one observability pipeline.
Reduce alert fatigue
Hit the ground running with opinionated alerts from integrations, forecasts, outliers, synthetics, service level objectives (SLOs), and services.
Faster MTTR, no context switching needed
Build alerts next to your telemetry and incident management tools in Grafana Cloud in order to seamlessly transition from incident response to triage to resolution.
How Grafana Alerting works

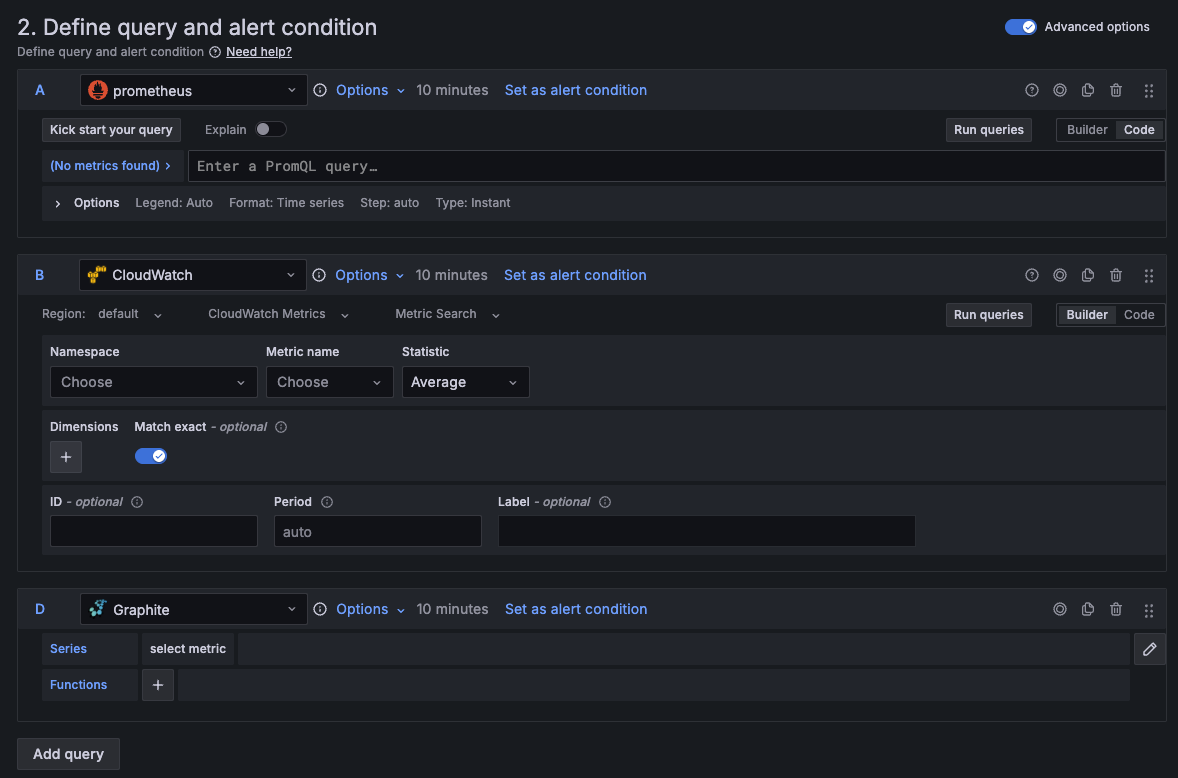
Focus on alerts, not moving data
Create queries and expressions from multiple data sources — no matter where your data is stored — giving you the flexibility to combine your data in new and unique ways.
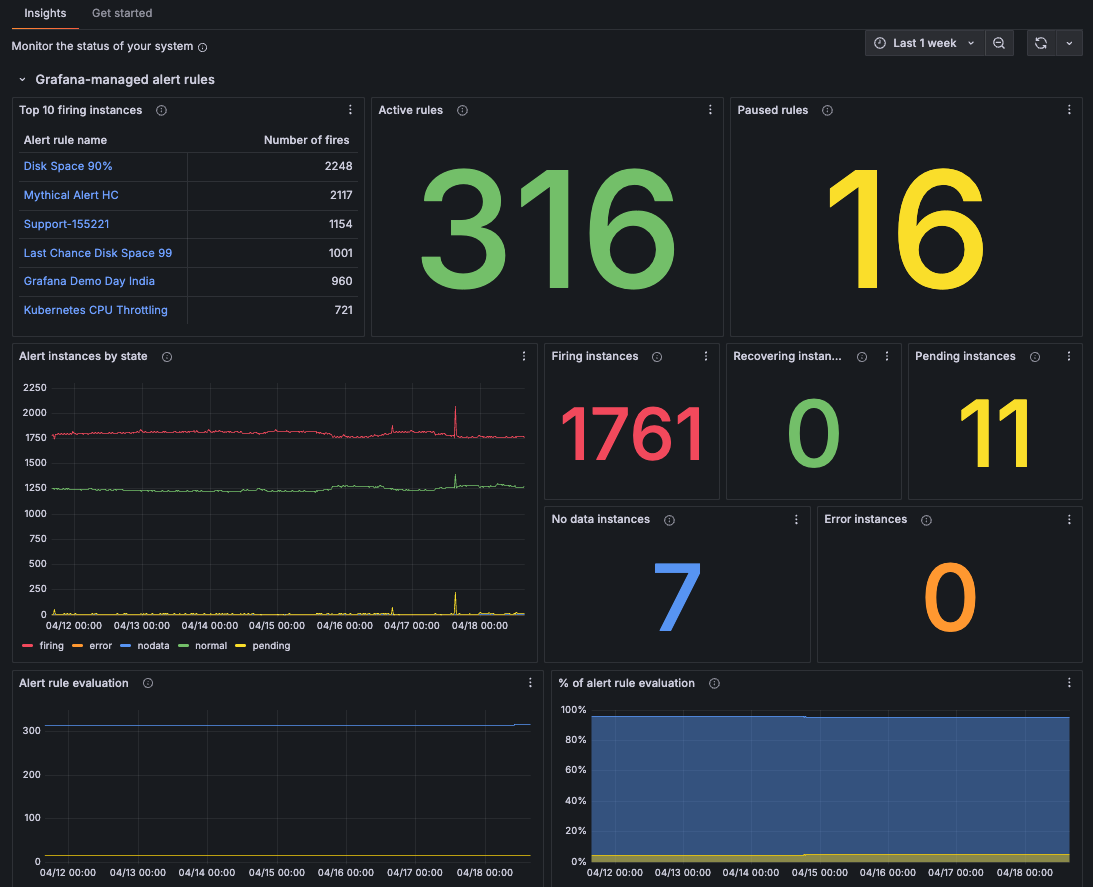
Alerting that scales with your infrastructure
Built on the Prometheus alerting model, Grafana Alerting is designed for scalability, flexibility, and reliability. With powerful features like dynamic routing, grouping, and silencing — plus advanced enterprise-grade capabilities — you can efficiently manage alerts at any scale.
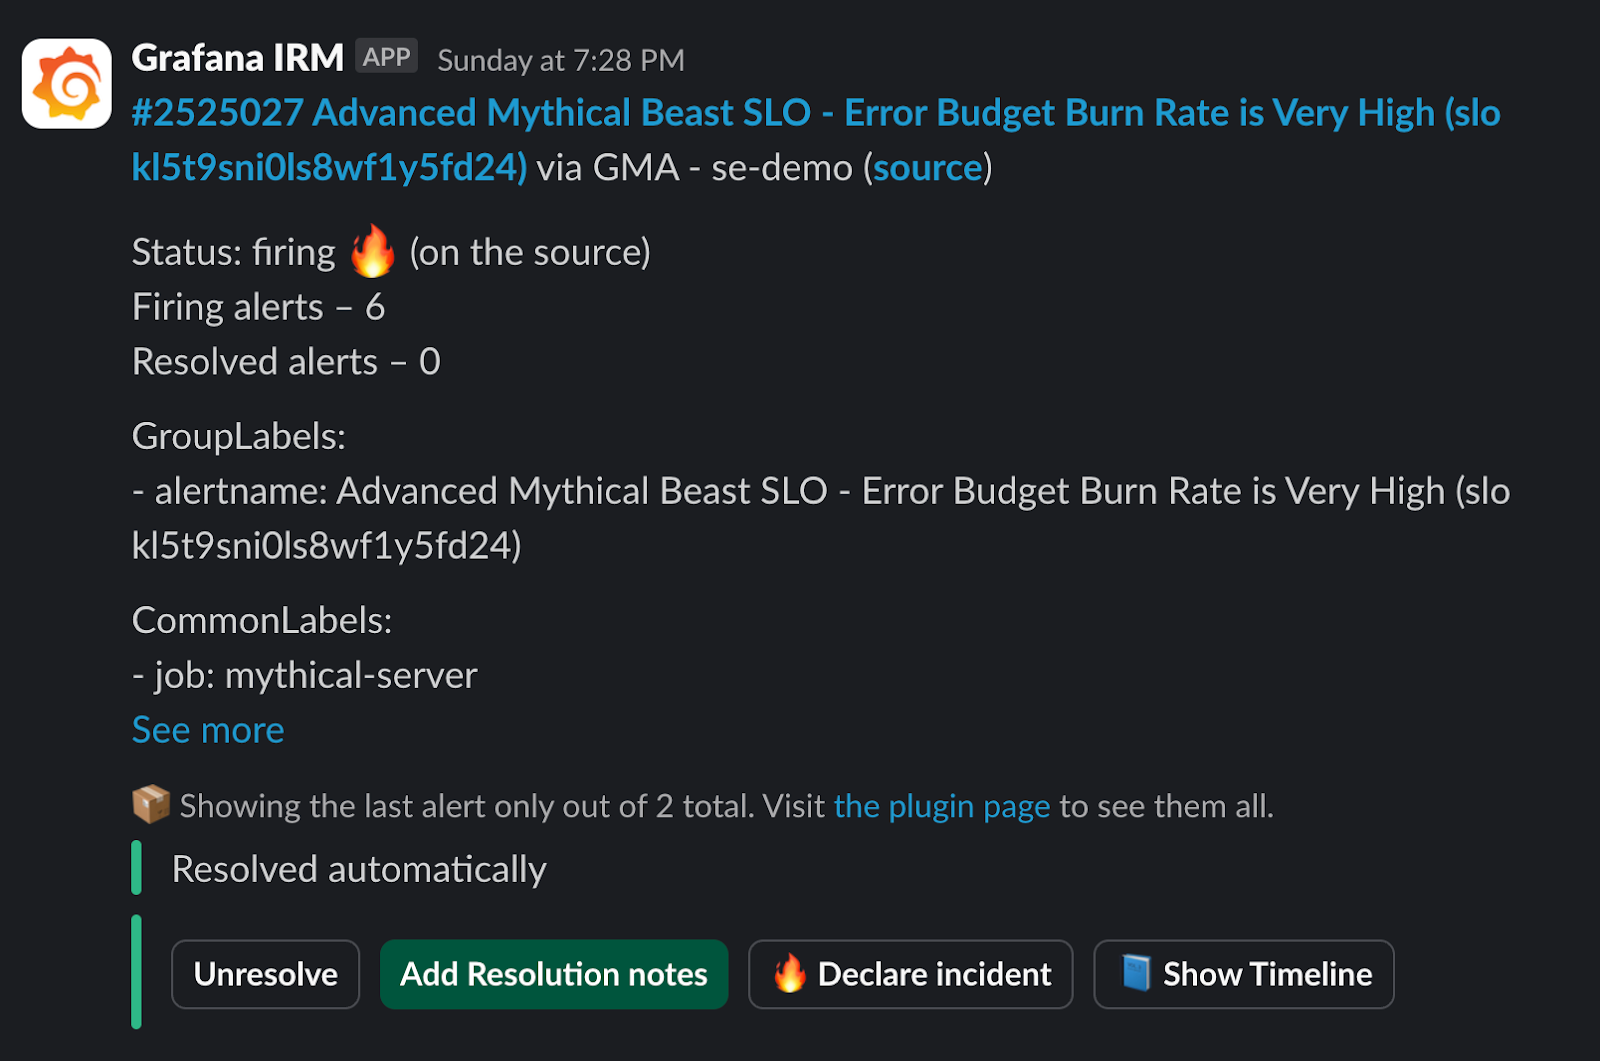
Unify alerts, incident response, services, and SLOs
Leverage SLOs and anomaly detection to identify potential issues before they impact your system. Streamline on-call management, automate escalations, and collaborate effectively during incidents with Grafana Cloud IRM.
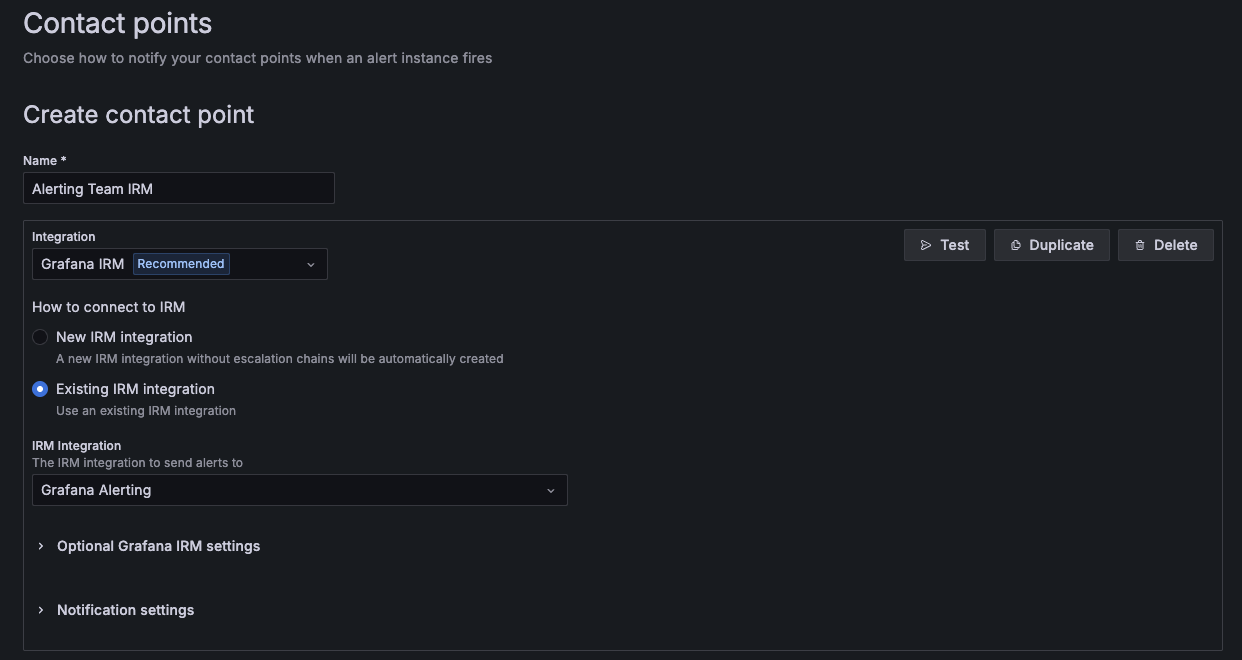
Integrate with existing workflows and tools
It’s easy to get started
Full implementation details and best practices
1
Sign up
Create your free Grafana Cloud account
2
Set up
Configure an alert with a few simple clicks
3
Manage
Add, edit, and manage all your Grafana and Prometheus-style alerts on a single page