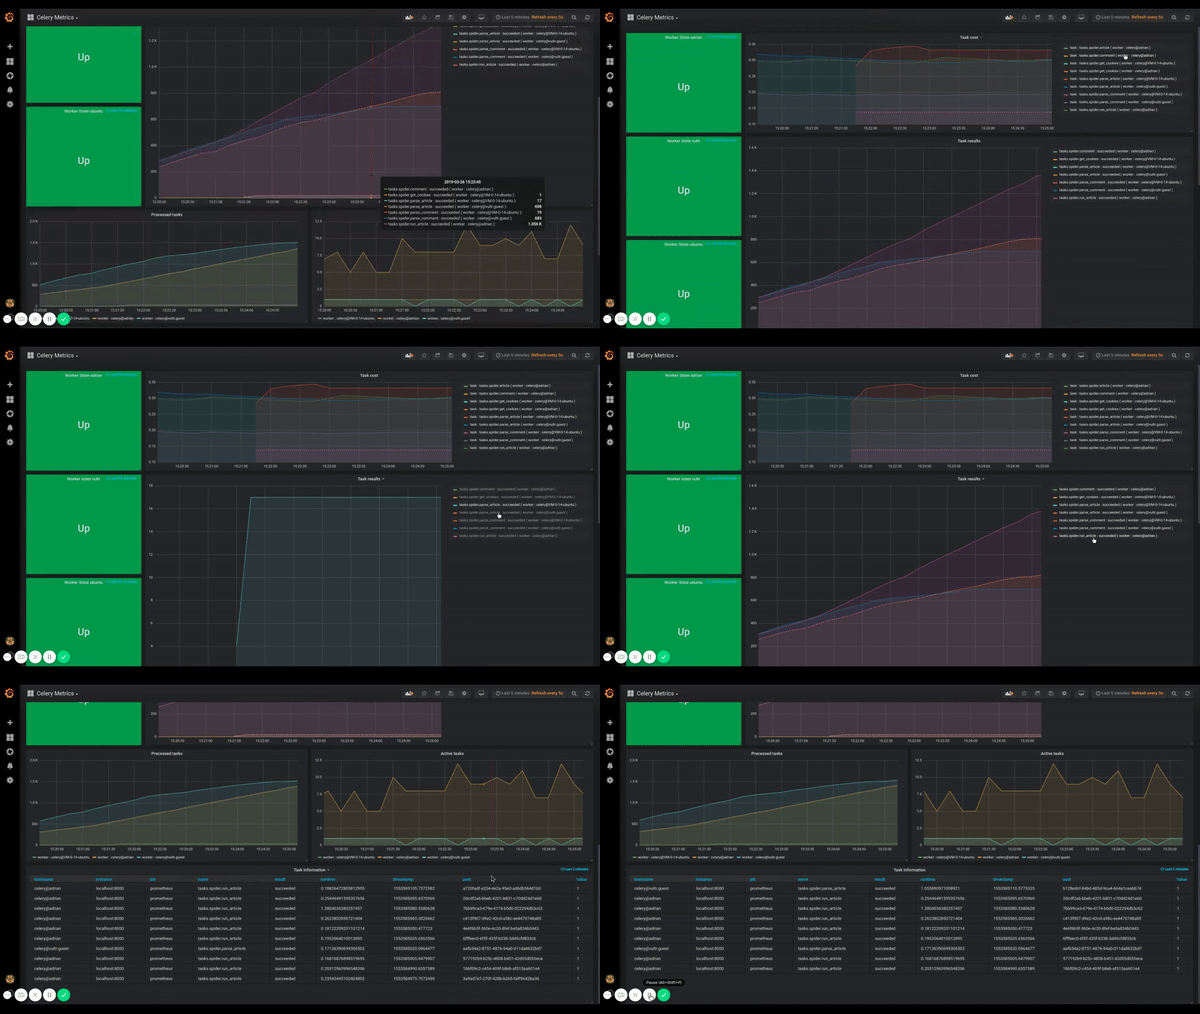
Celery Metrics
Monitoring Celery task and worker events with metrics, and recording tasks information, saved with Prometheus
Building a crawler with distributed task queues (Celery) and fetching data with a reliable monitor system
Data source config
Collector config:
Upload an updated version of an exported dashboard.json file from Grafana
| Revision | Description | Created | |
|---|---|---|---|
| Download |

