Kubernetes Cluster metrics (Prometheus)
Summary metrics about cluster health, deployments, statefulsets, nodes, pods, containers running on Kubernetes nodes. Dashboard was taken from here. This version does not reqiure you to setup the Kubernetes-app plugin. (https://github.com/grafana/kubernetes-app) Use this Helm chart to launch Grafana into a Kubernetes cluster. It will include this dashboard and many more dashboards to give you visibility into the Kubernetes Cluster. (https://github.com/sekka1/cloud-public/tree/master/kubernetes/pods/grafana-helm)
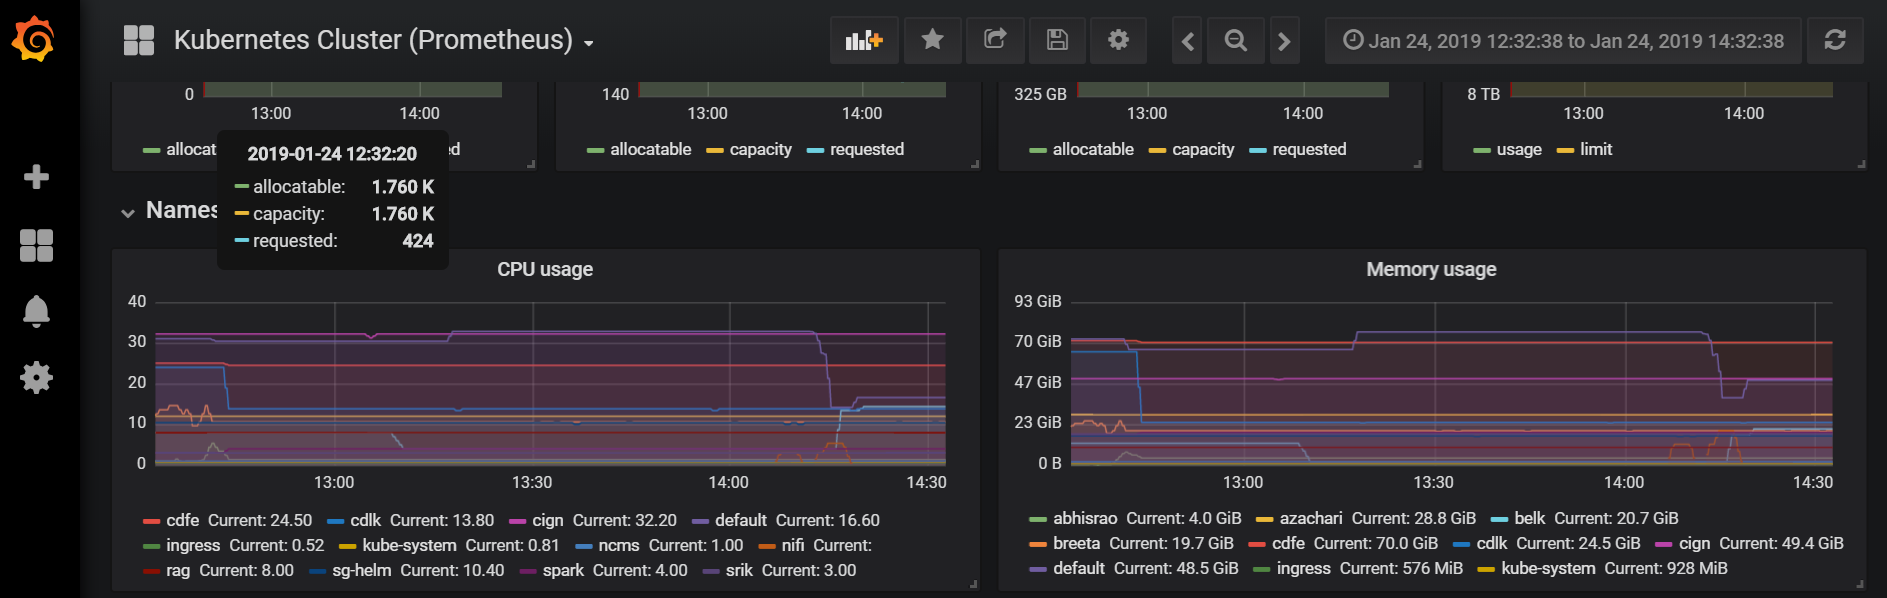
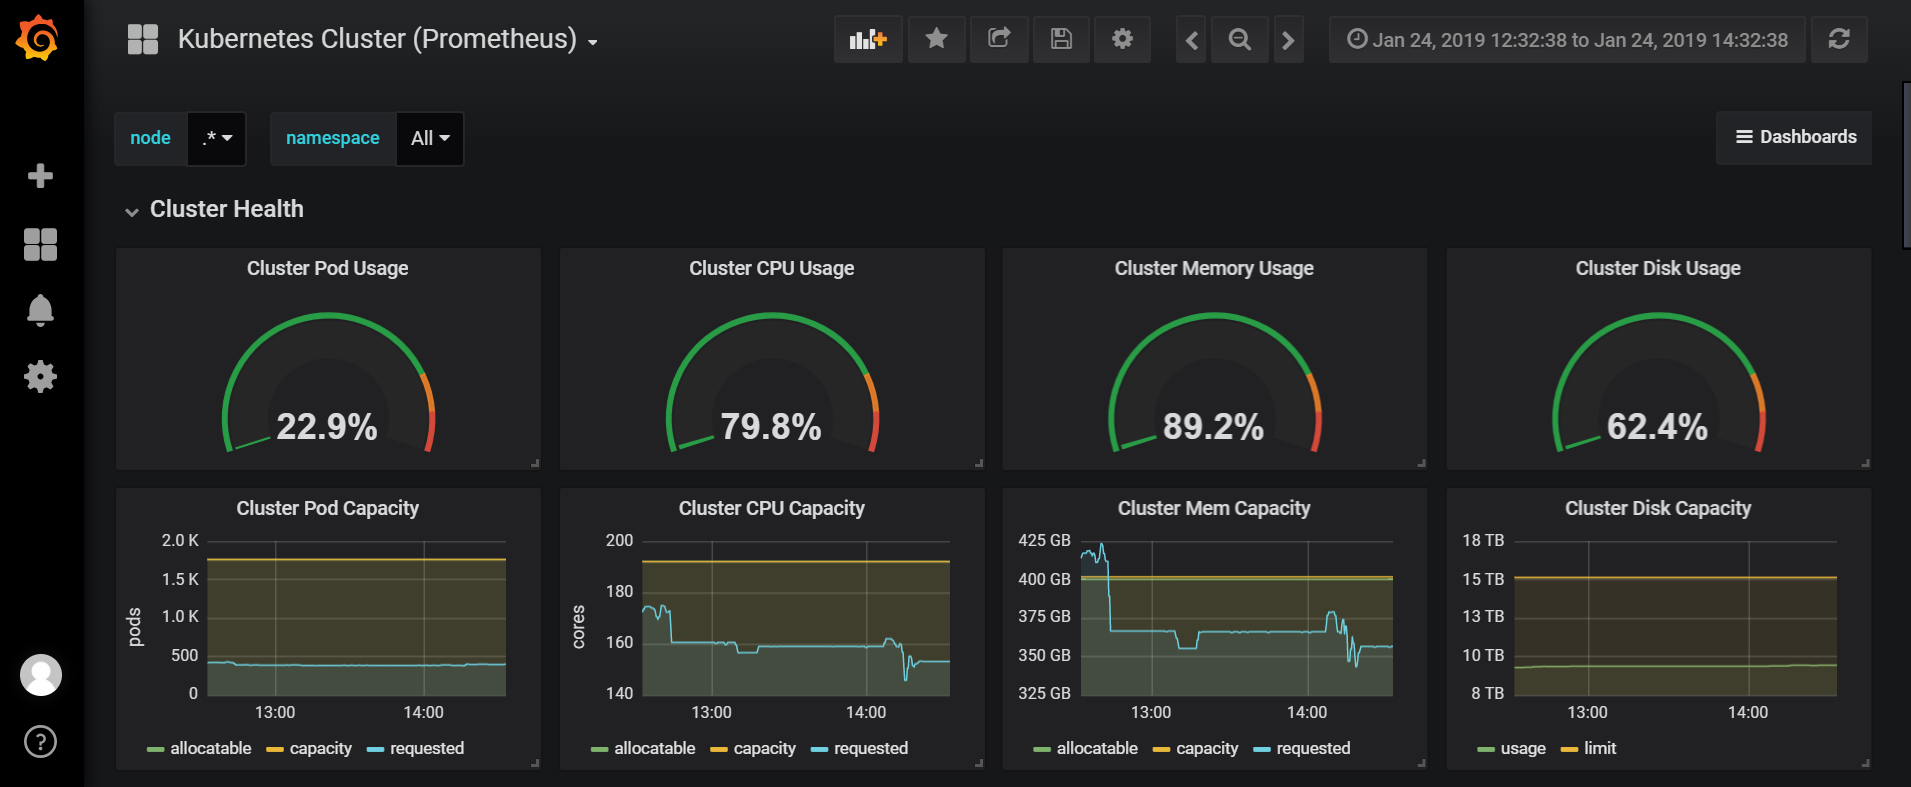
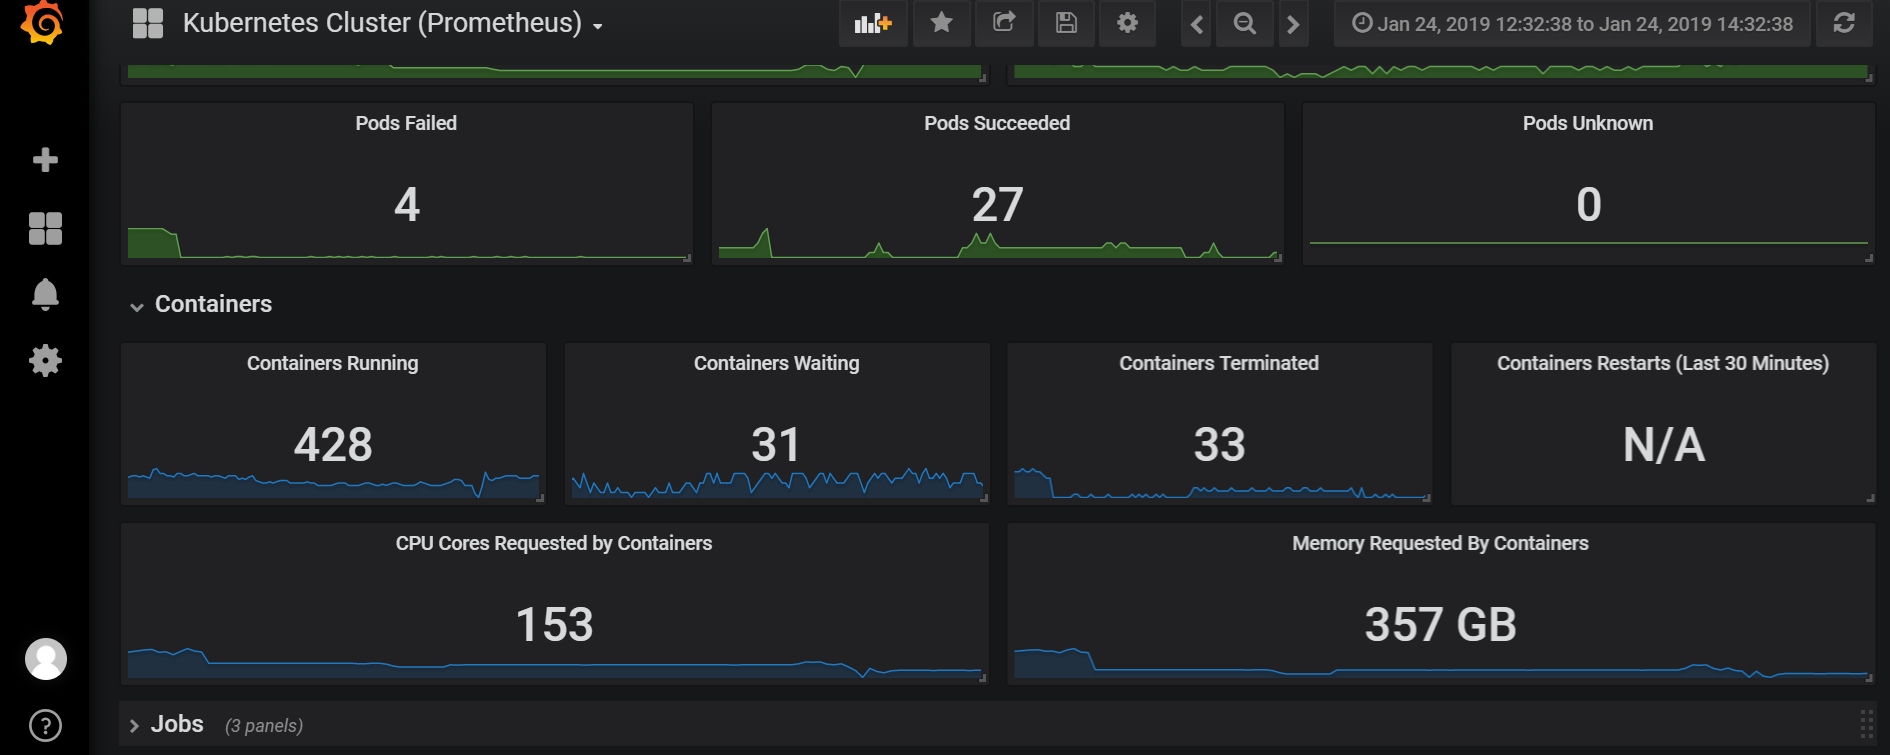
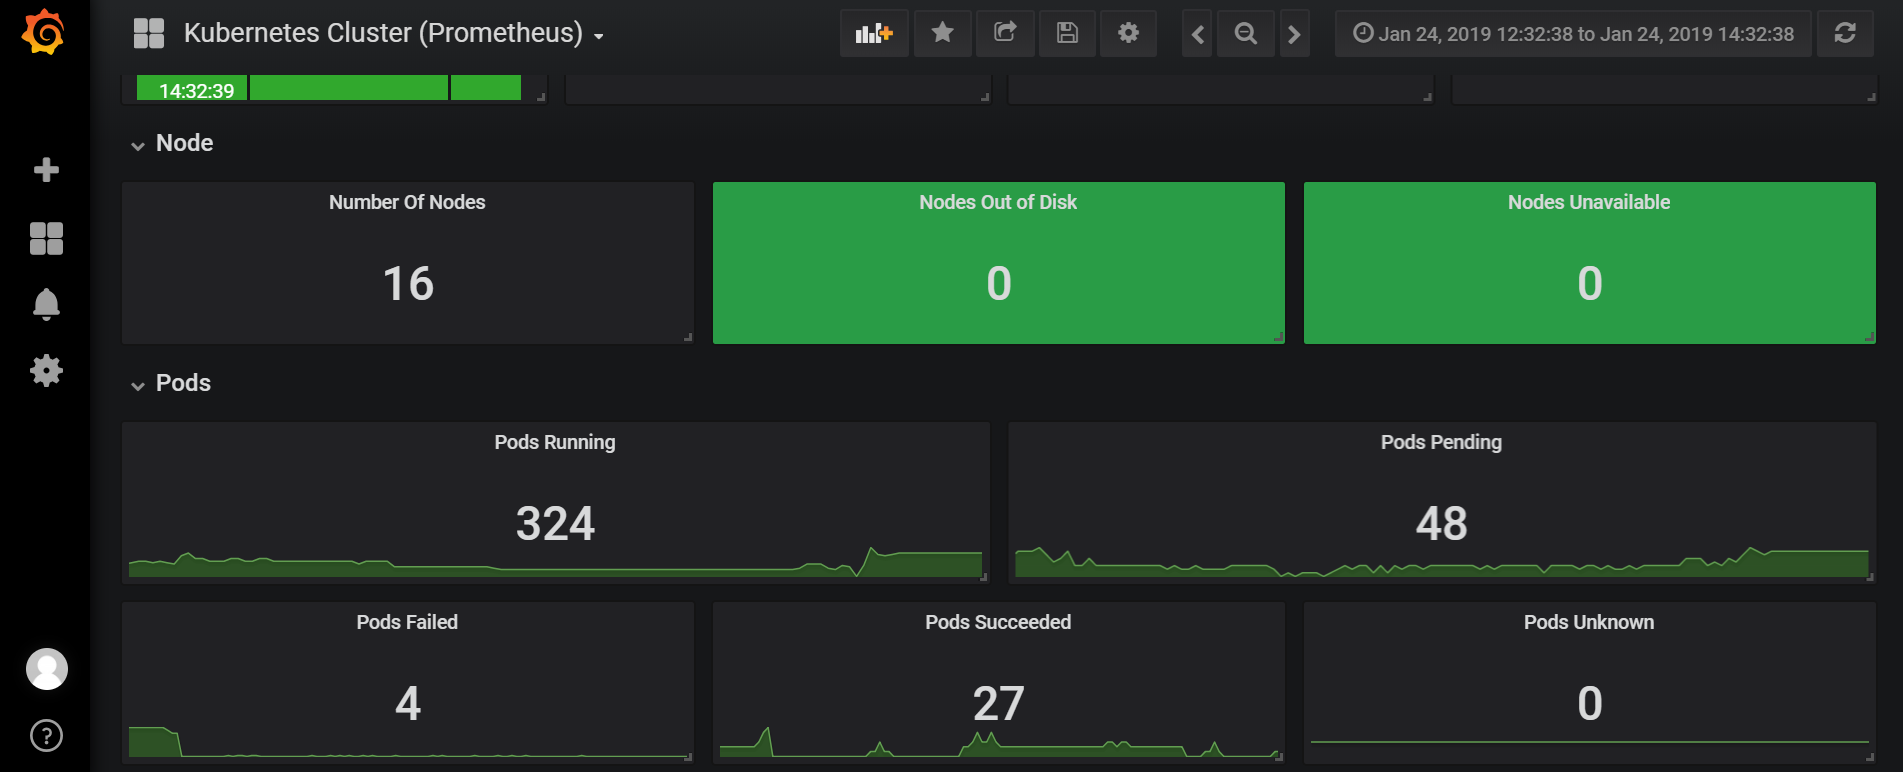
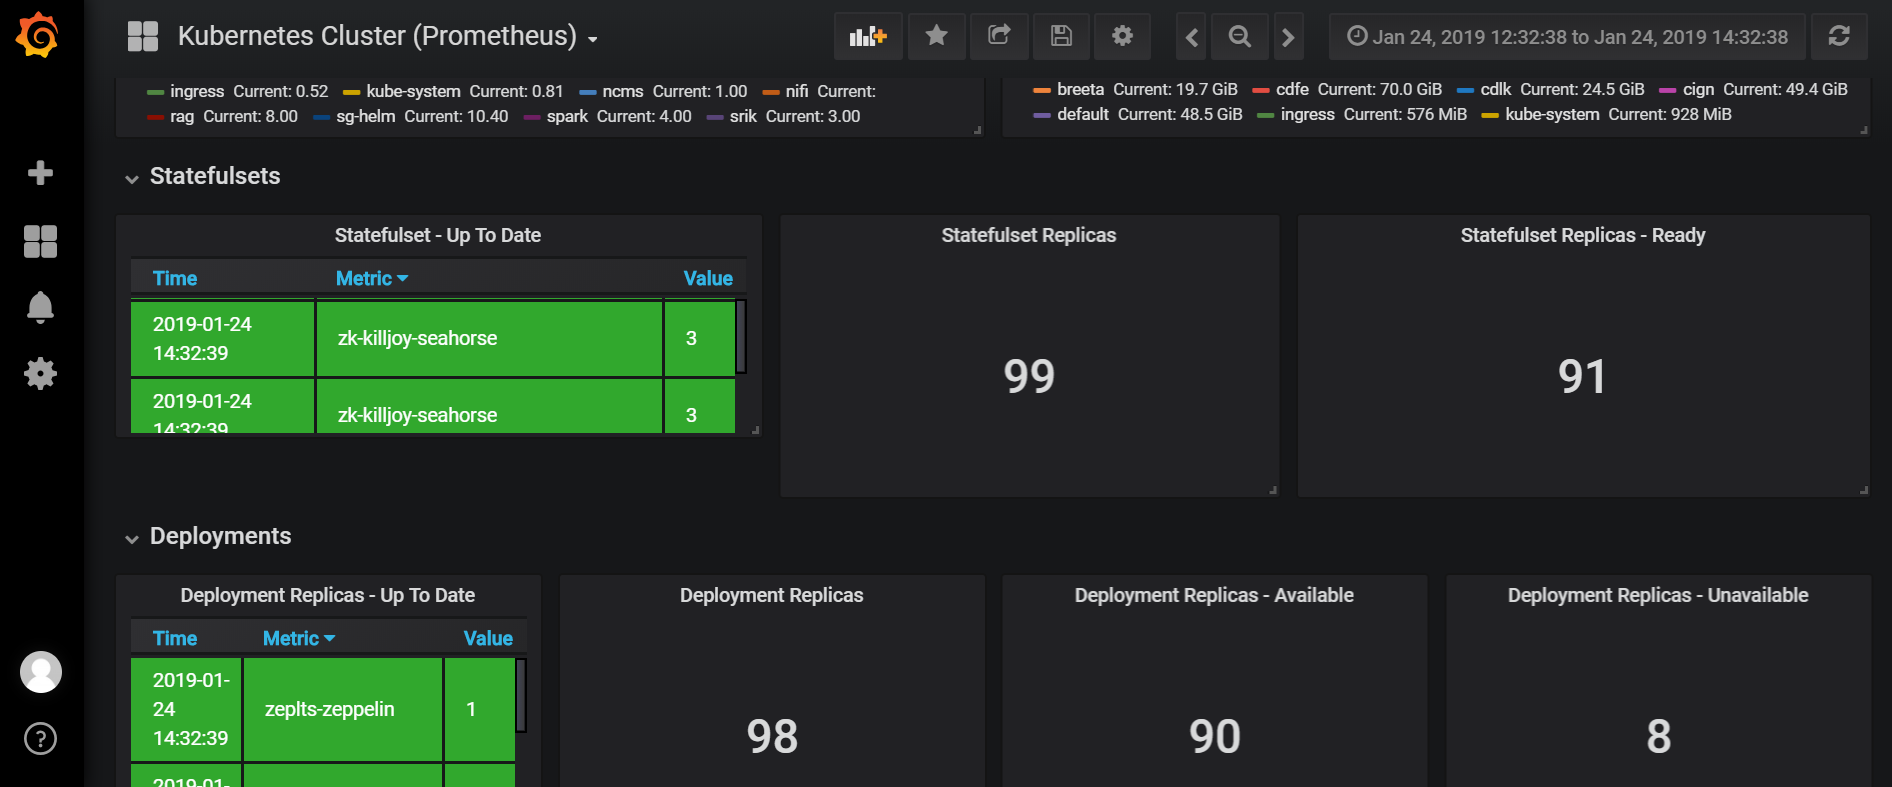
Summary metrics about cluster health, deployments, statefulsets, nodes, pods, containers running on Kubernetes nodes scraped by prometheus. Dashboard was taken from here. This version does not reqiure you to setup the Kubernetes-app plugin. (https://github.com/grafana/kubernetes-app) Use this Helm chart to launch Grafana into a Kubernetes cluster. It will include this dashboard and many more dashboards to give you visibility into the Kubernetes Cluster. (https://github.com/sekka1/cloud-public/tree/master/kubernetes/pods/grafana-helm)
Gist is here Based on JMX exporter prometheus
Prometheus configuration
scrape_configs:
- job_name: kubernetes-pods
  scrape_interval: 1m
  scrape_timeout: 10s
  metrics_path: /metrics
  scheme: http
  kubernetes_sd_configs:
  - api_server: null
    role: pod
    namespaces:
      names: []
  relabel_configs:
  - source_labels: [__meta_kubernetes_pod_annotation_prometheus_io_scrape]
    separator: ;
    regex: "true"
    replacement: $1
    action: keep
  - source_labels: [__meta_kubernetes_pod_annotation_prometheus_io_path]
    separator: ;
    regex: (.+)
    target_label: __metrics_path__
    replacement: $1
    action: replace
  - source_labels: [__address__, __meta_kubernetes_pod_annotation_prometheus_io_port]
    separator: ;
    regex: ([^:]+)(?::\d+)?;(\d+)
    target_label: __address__
    replacement: $1:$2
    action: replace
  - separator: ;
    regex: __meta_kubernetes_pod_label_(.+)
    replacement: $1
    action: labelmap
  - source_labels: [__meta_kubernetes_namespace]
    separator: ;
    regex: (.*)
    target_label: namespace
    replacement: $1
    action: replace
  - source_labels: [__meta_kubernetes_pod_name]
    separator: ;
    regex: (.*)
    target_label: kubernetes_pod_name
    replacement: $1
    action: replace
Data source config
Collector config:
Upload an updated version of an exported dashboard.json file from Grafana
| Revision | Description | Created | |
|---|---|---|---|
| Download |
Kubernetes
Monitor your Kubernetes deployment with prebuilt visualizations that allow you to drill down from a high-level cluster overview to pod-specific details in minutes.
Learn more