
Memory Overview (Designed for PMM)
The dashboard that displays metrics related to memory usage on Linux systems. Designed for https://www.percona.com/software/database-tools/percona-monitoring-and-management
The dashboard leverages information collected by node_exporter. The graphs take advantage of /proc filesystem files, specifically:
meminfo: Provides information about distribution and utilization of memory. This varies by architecture and compile options.
vmstat: Provides information about block IO and CPU activity in addition to memory.
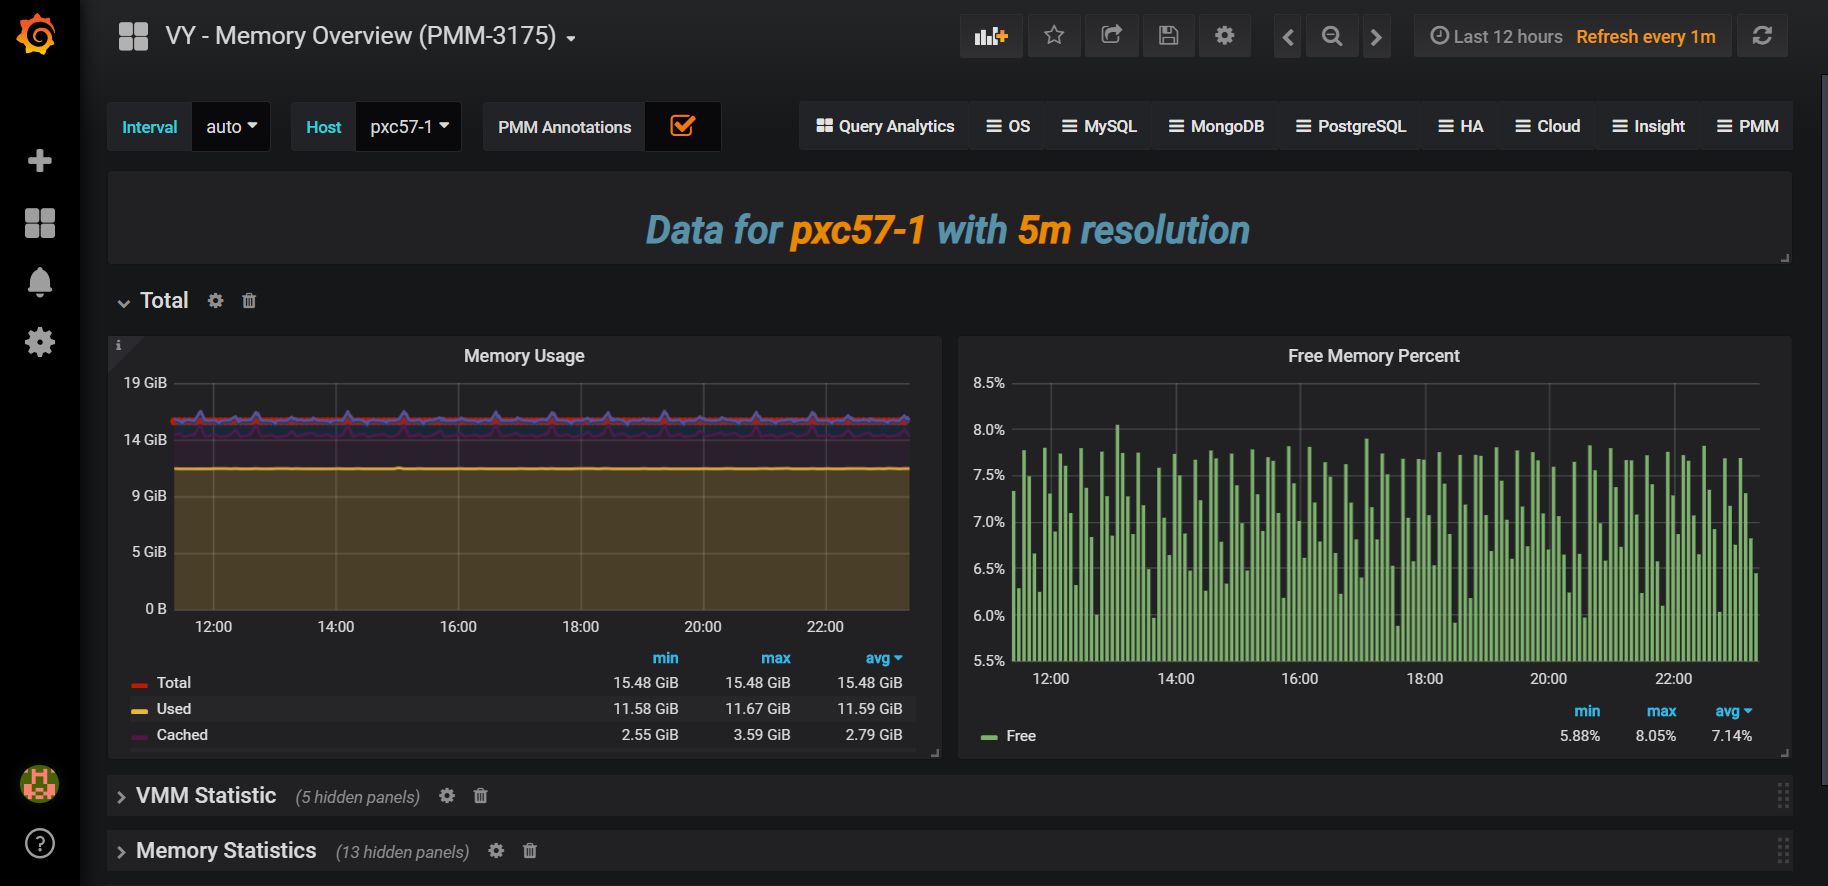
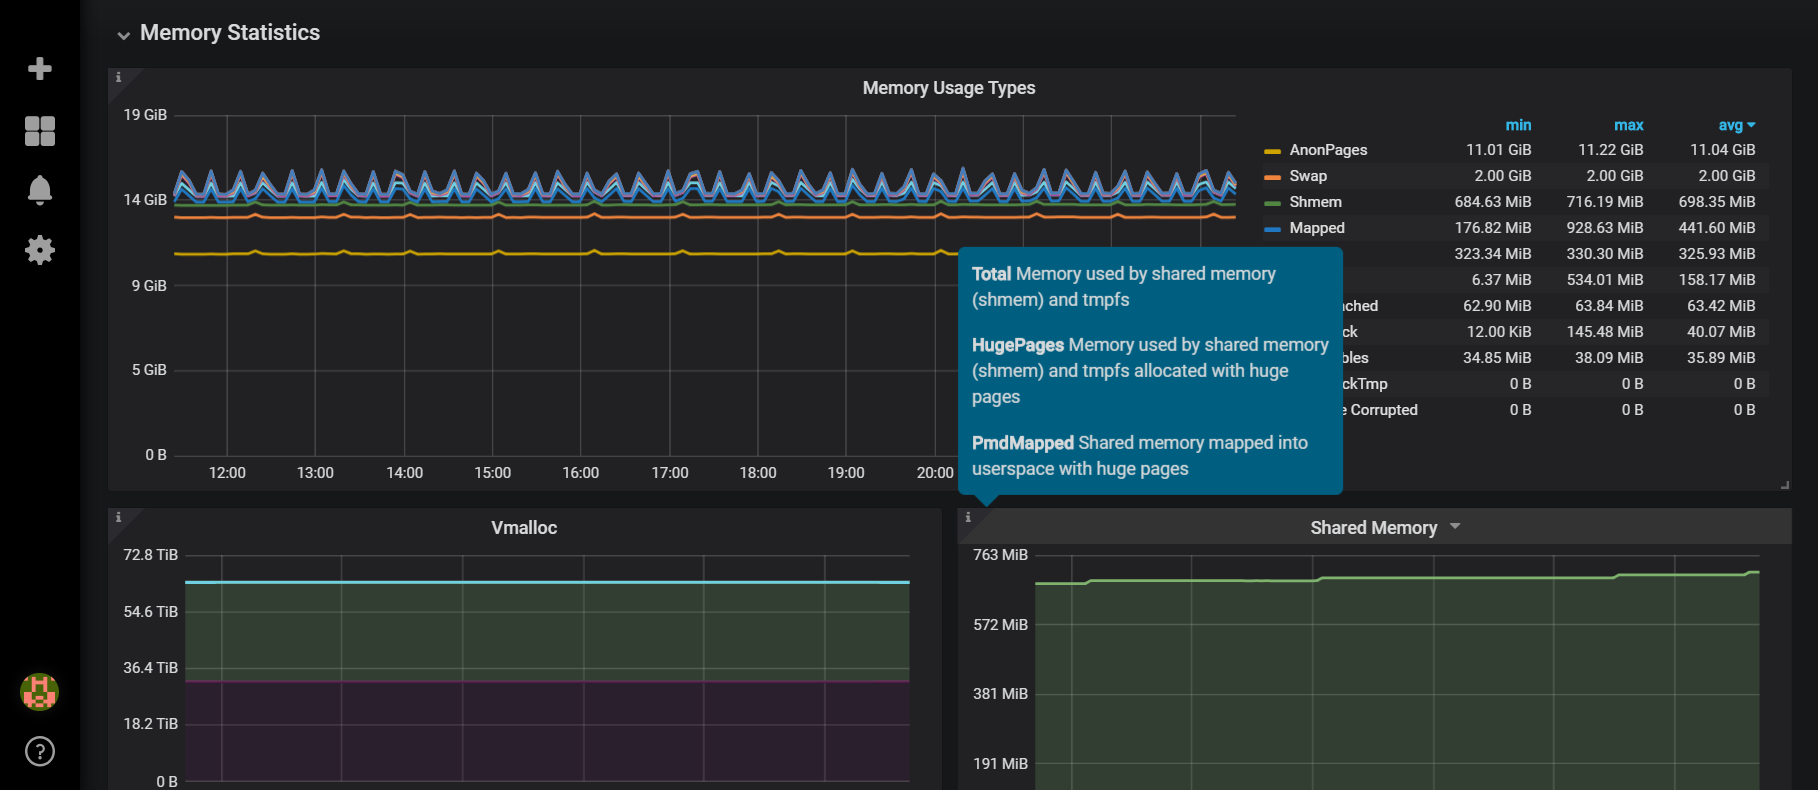
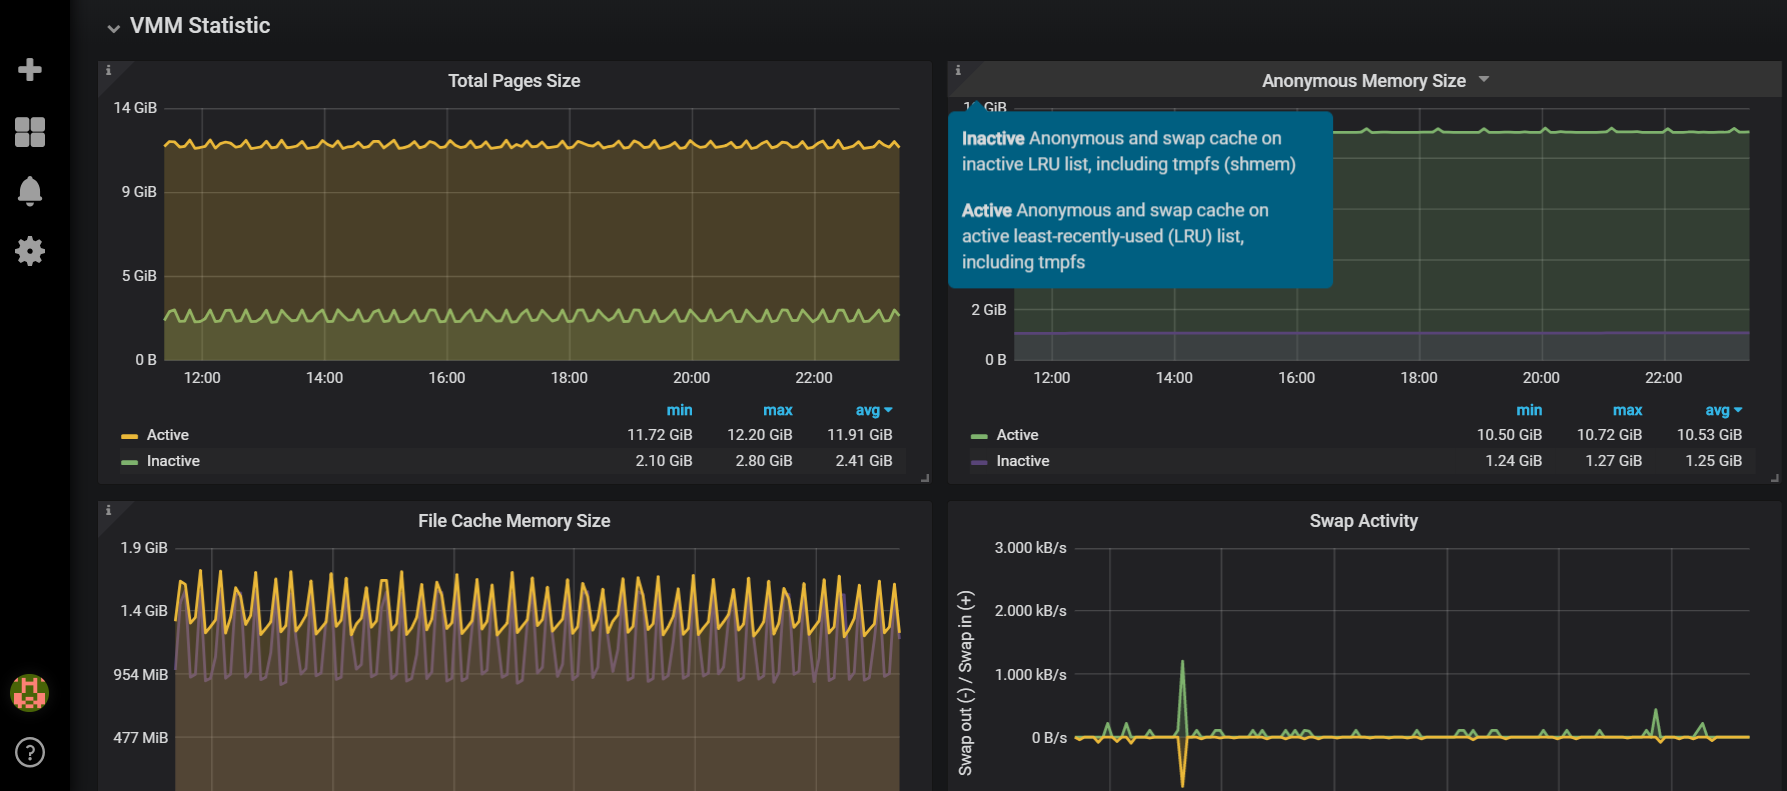
The information is split into five sections: Total Memory, VMM (Virtual Memory Manager) Statistics, Memory Statistics, Number and Dynamic of Pages, Pages per Zone
Data source config
Collector type:
Collector plugins:
Collector config:
Revisions
Upload an updated version of an exported dashboard.json file from Grafana
| Revision | Description | Created | |
|---|---|---|---|
| Download |