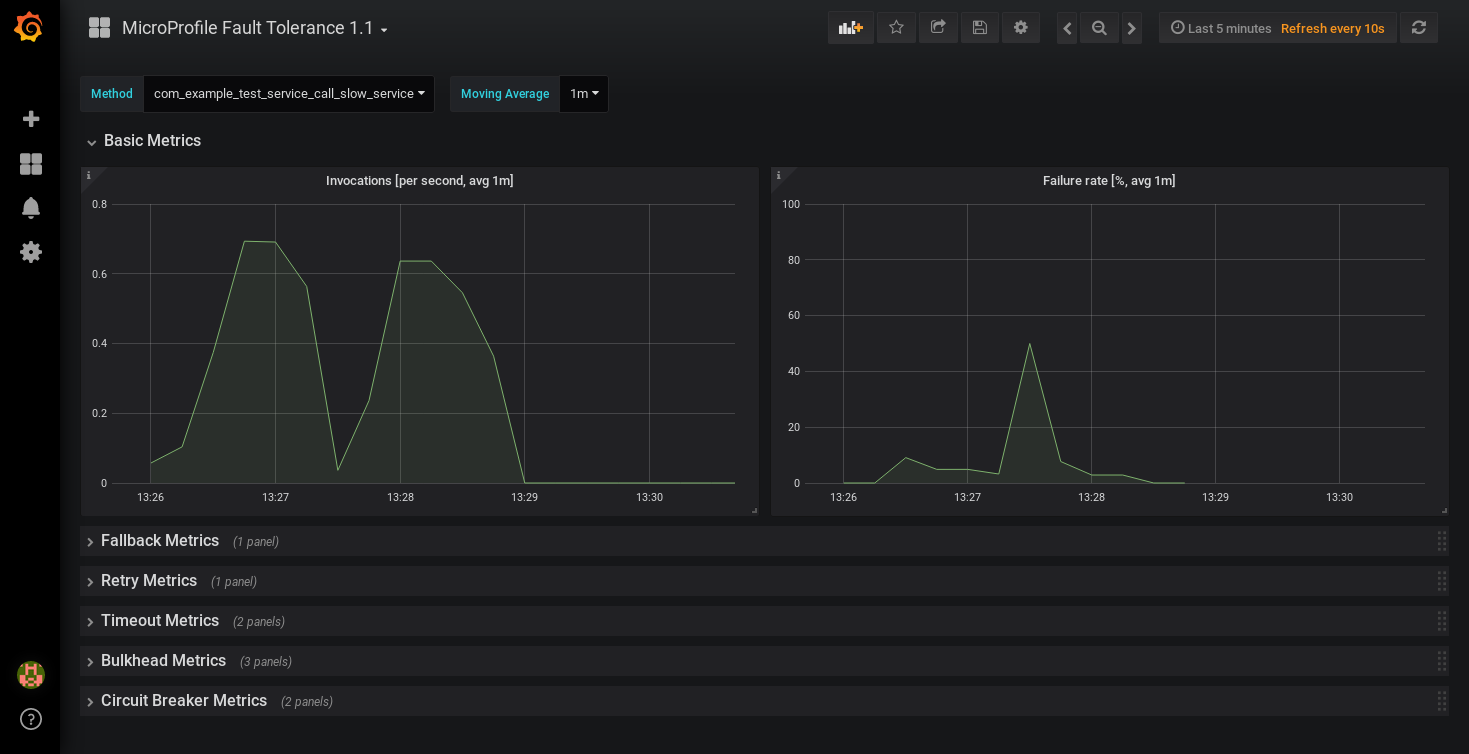
MicroProfile Fault Tolerance 1.1
Displays metrics collected by methods annotated with MicroProfile Fault Tolerance annotations
This dashboard shows graphs of the metrics collected from an application server using Microprofile Fault Tolerance 1.1.
Requirements
An application server which supports Microprofile Fault Tolerance 1.1. E.g.
An application which uses the MicroProfile Fault Tolerance annotations.
Instructions
- Deploy your app on the app server.
- Configure prometheus to collect metrics from the app server.
- Import this dashboard.
- At the top of the dashboard, there's a drop down which will be populated with the names of the annotated methods from your application.
- If nothing appears here, first make sure you've called the annotated method and that the selected time range covers the execution. Then refresh the dashboard.
Data source config
Collector config:
Upload an updated version of an exported dashboard.json file from Grafana
| Revision | Description | Created | |
|---|---|---|---|
| Download |

