Postgres Overview - more info
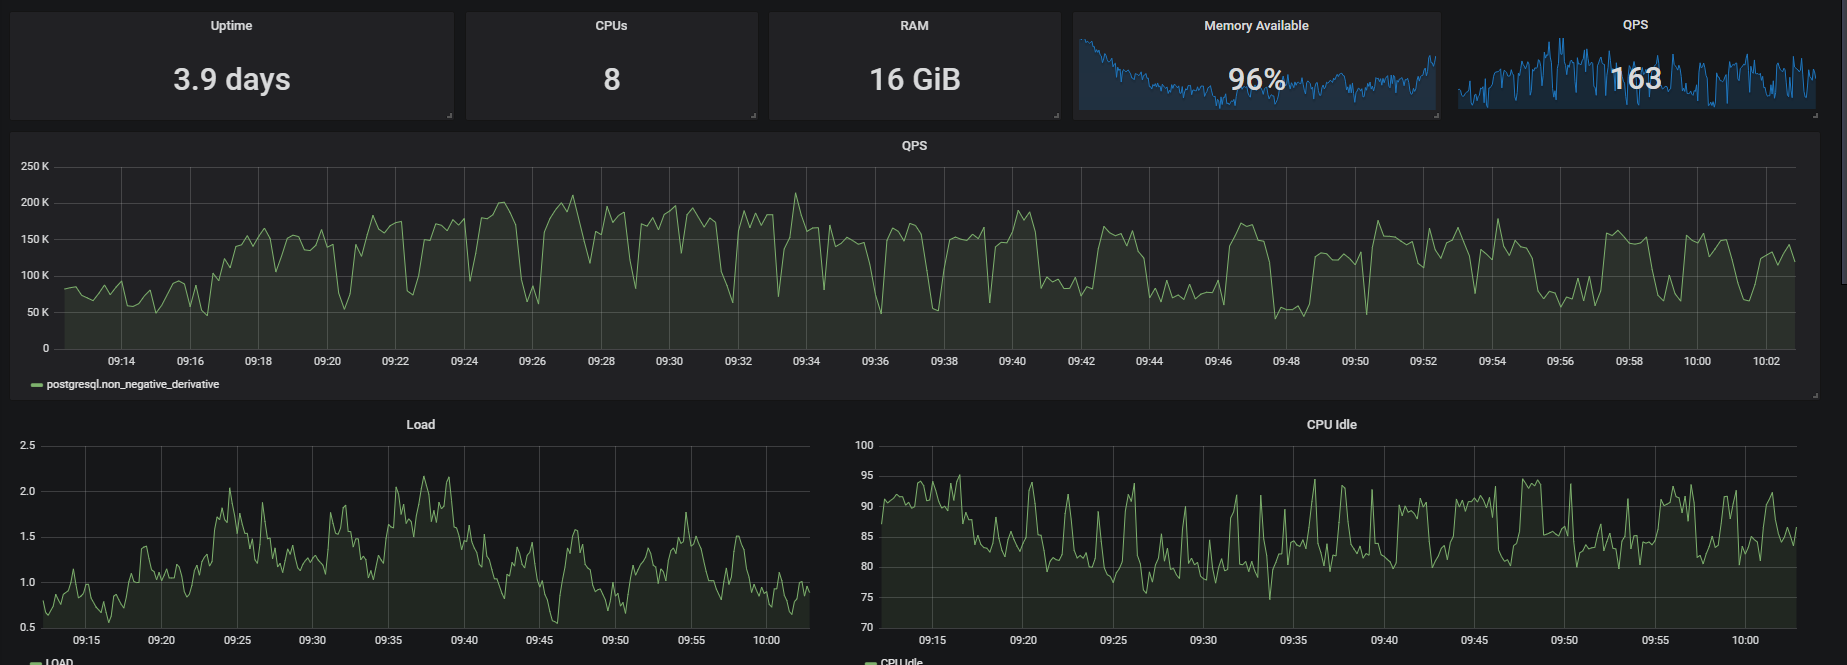
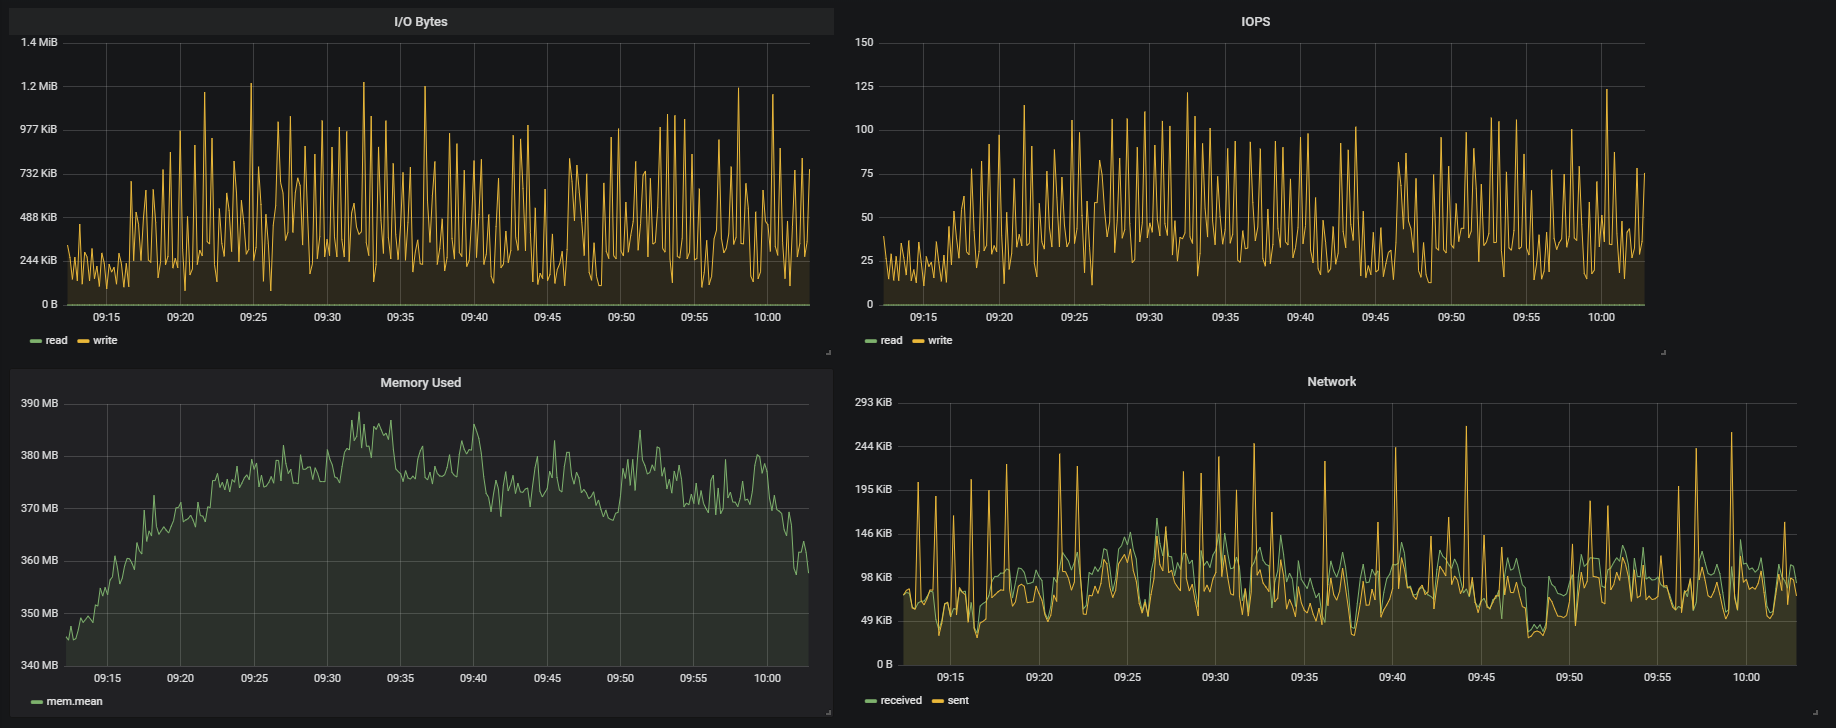
Dashboard allow to monitor: - Uptime - N. of CPUs - GB of RAM - Memory Available on the $host - Memory Used on the $host - QPS (singlestat and graph) - Rows fetched/returned/inserted/updated/deleted per second - Buffers state - Deadlocks and conflicts graph - IOPS and I/O Bytes - CPU Idle The author assumes that the metrics are scraped from various hosts and databases. That's why there are placed two templates: $host and $db. Graphs would change accordingly to selected value.
Data source config
Collector config:
Upload an updated version of an exported dashboard.json file from Grafana
| Revision | Description | Created | |
|---|---|---|---|
| Download |
PostgreSQL
Easily monitor your deployment of PostgreSQL, the open source relational database, with Grafana Cloud's out-of-the-box monitoring solution.
Learn more


