
Kubernetes Kafka resource metrics
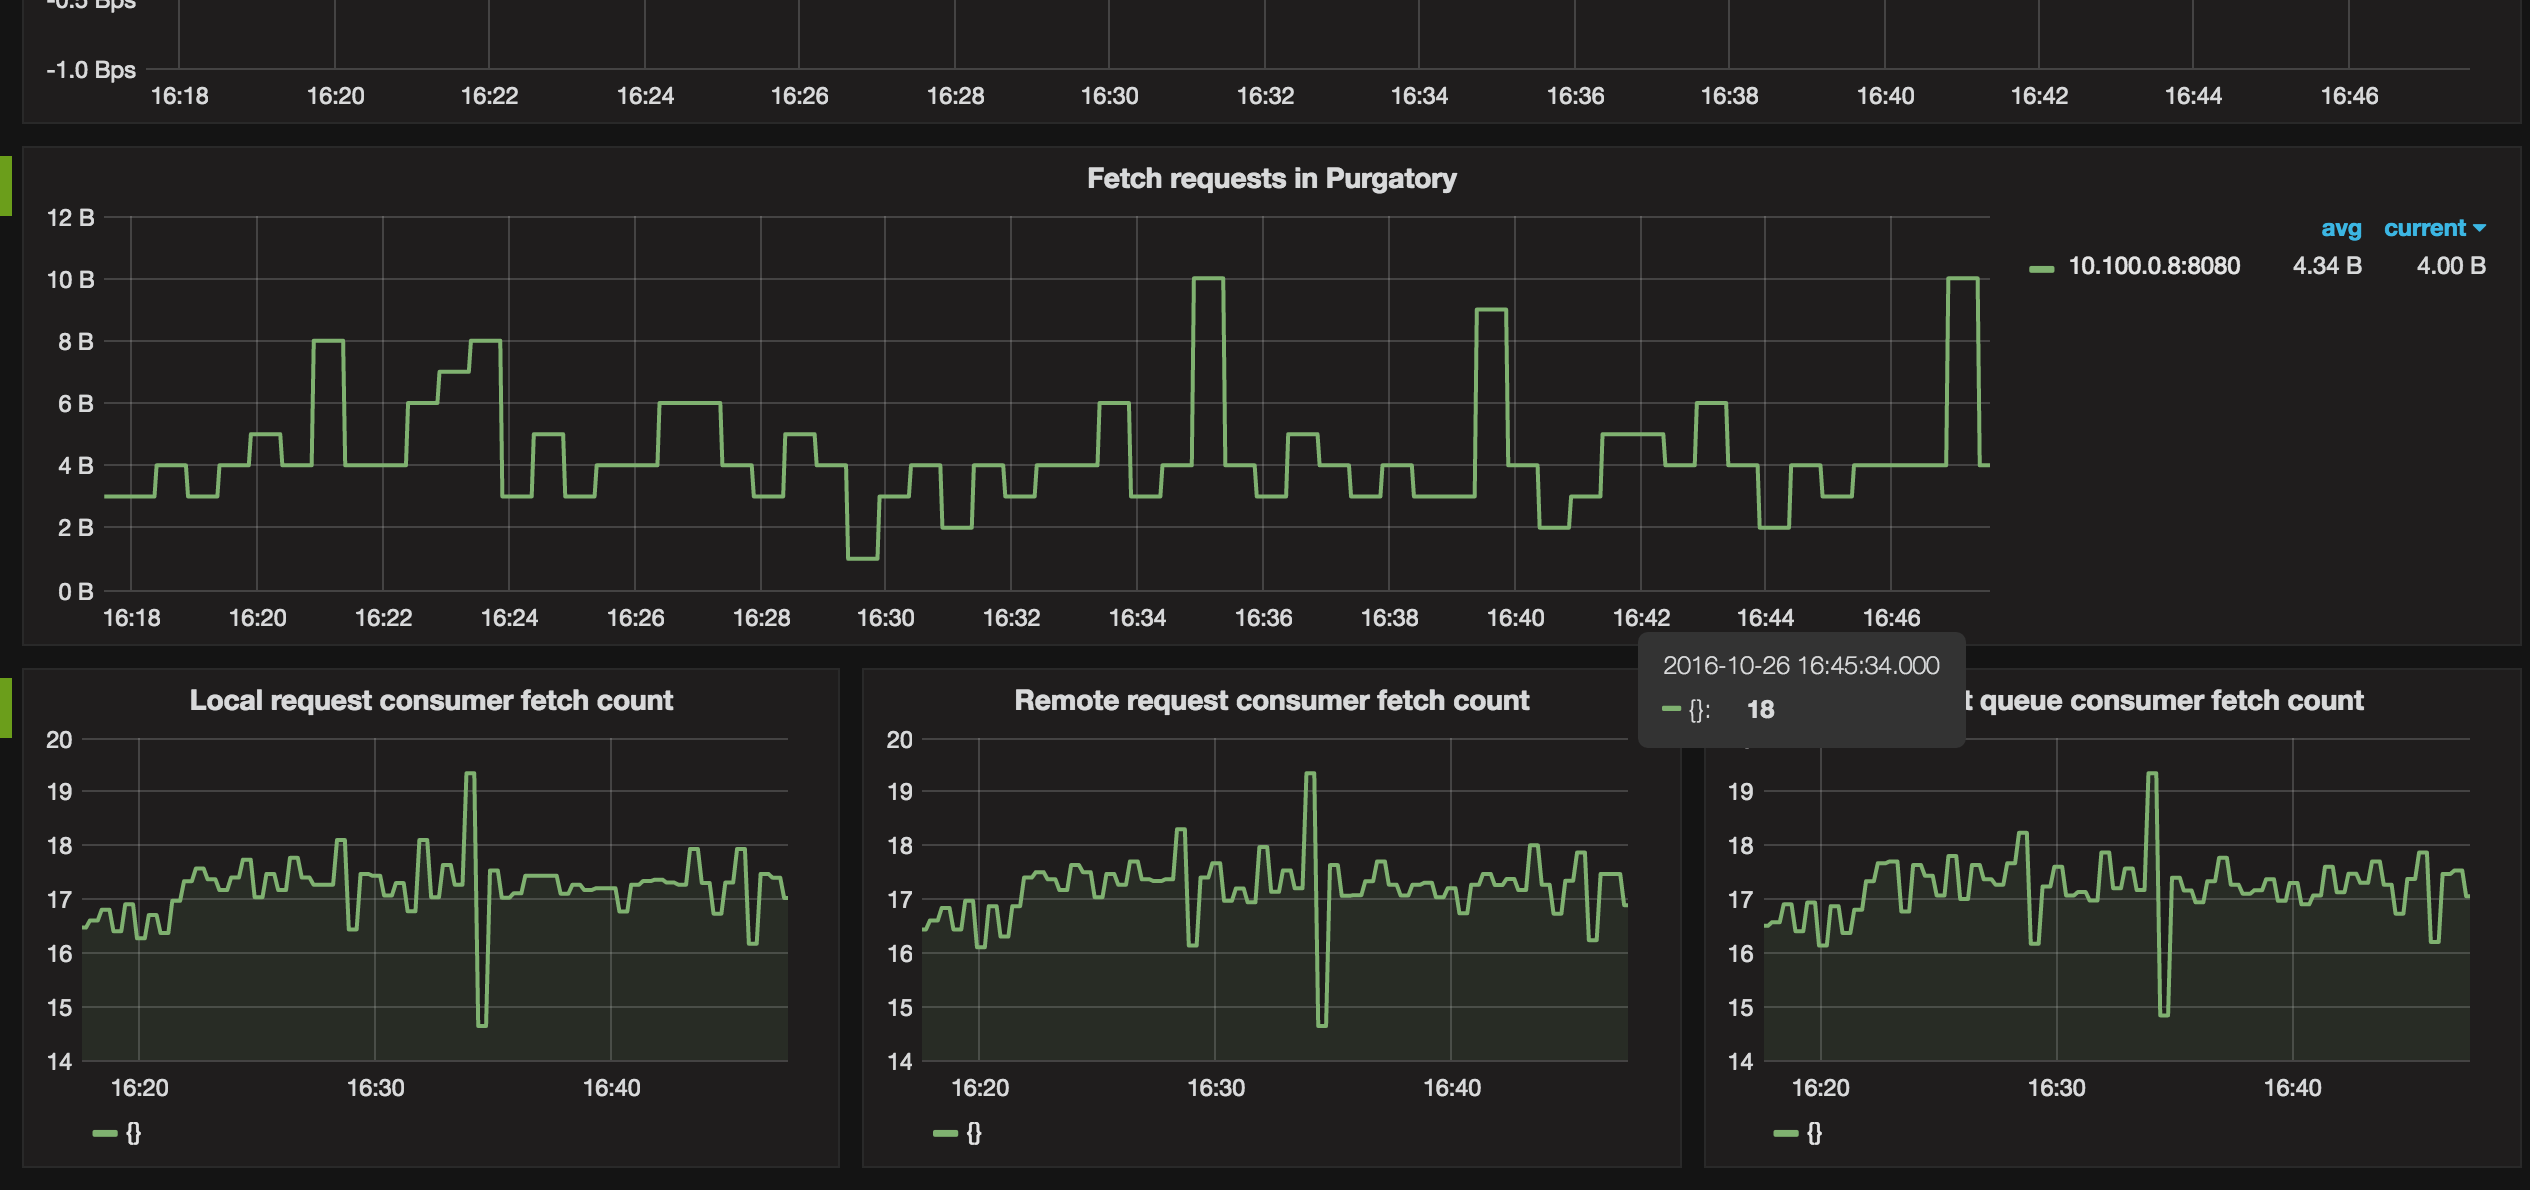
Monitors Kafka metrics from Prometheus. Shows active controllers, partitions, ISR shrink rate, purgatory size etc. Uses JMX exporter.
Setup JMX exporter: https://github.com/prometheus/jmx_exporter as it exposes kafka metrics in our kubernetes cluster.
Data source config
Collector type:
Collector plugins:
Collector config:
Revisions
Upload an updated version of an exported dashboard.json file from Grafana
| Revision | Description | Created | |
|---|---|---|---|
| Download |
Kubernetes
Monitor your Kubernetes deployment with prebuilt visualizations that allow you to drill down from a high-level cluster overview to pod-specific details in minutes.
Learn more