Fortigate
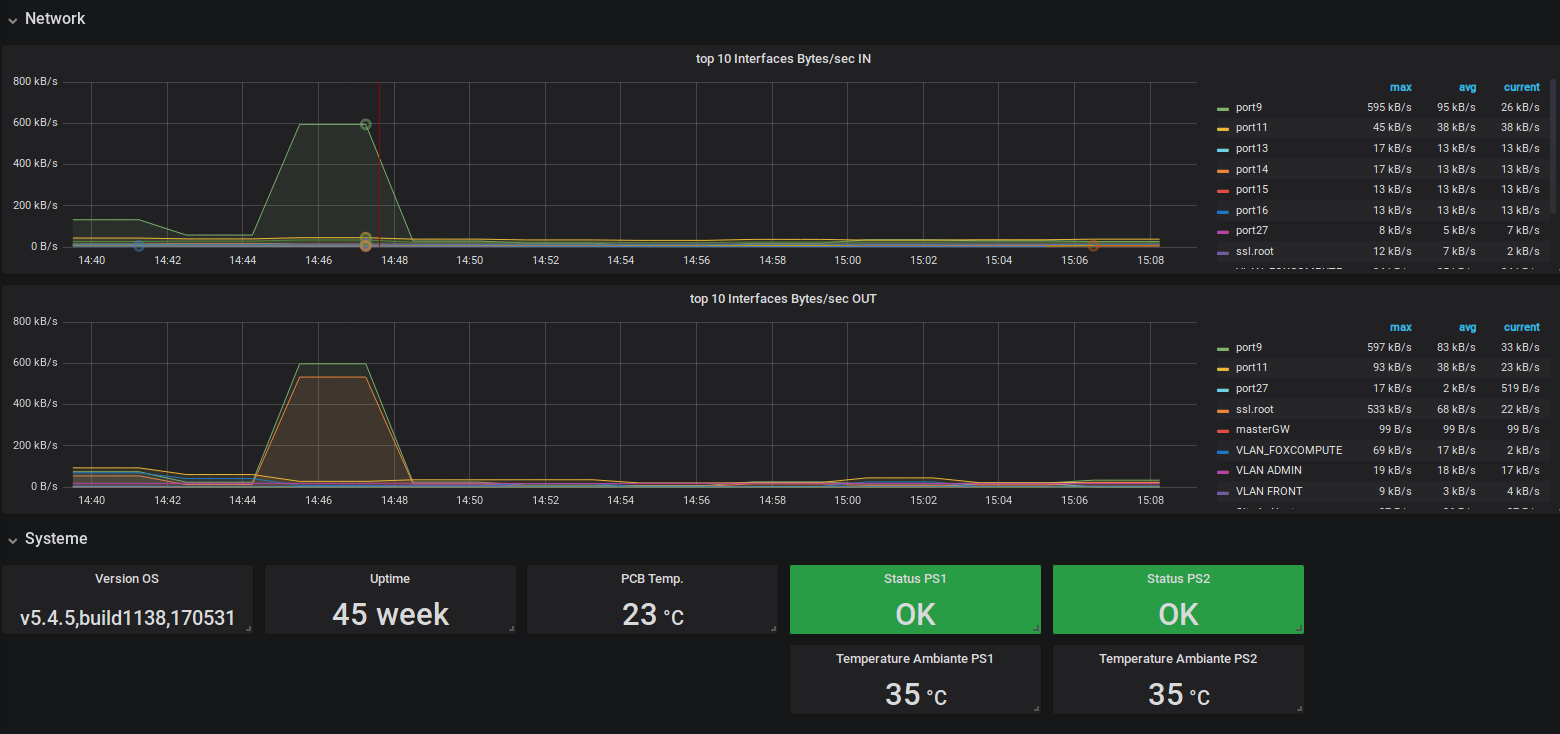
Monitor your fortigate instances with grafana and prometheus via SNMP. Tested with fortigate 1000D but should work well with other models.
Use prometheus snmp_exporter to get fortigate metrics via snmp.
i used the following generator(generator.yml):
fortigate_snmp:
  walk:
    - ifXTable
    - fgVpn
    - fgSystem
    - fgIntf
    - fgInetProto
  version: 3
  max_repetitions: 25
  timeout: 10s
  auth:
    username: your_username  # Required, no default. -u option to NetSNMP.
    security_level: authNoPriv  # Defaults to noAuthNoPriv. -l option to NetSNMP.
                                # Can be noAuthNoPriv, authNoPriv or authPriv.
    password: your_password  # Has no default. Also known as authKey, -A option to NetSNMP.
                # Required if security_level is authNoPriv or authPriv.
    auth_protocol: SHA  # MD5 or SHA, defaults to SHA. -a option to NetSNMP.
                      # Used if security_level is authNoPriv or authPriv.
with the following prometheus config :
  - job_name: 'snmp'
    static_configs:
      - targets:
        - x.x.x.x # fortigate device.
    scrape_interval: 3m
    scrape_timeout : 3m
    metrics_path: /snmp
    params:
      module: [fortigate_snmp]
    relabel_configs:
      - source_labels: [__address__]
        target_label: __param_target
      - source_labels: [__param_target]
        target_label: instance
      - target_label: __address__
        replacement: snmp_exporter:9116  # SNMP exporter.
Data source config
Collector config:
Upload an updated version of an exported dashboard.json file from Grafana
| Revision | Description | Created | |
|---|---|---|---|
| Download |


