Kubernetes Cluster
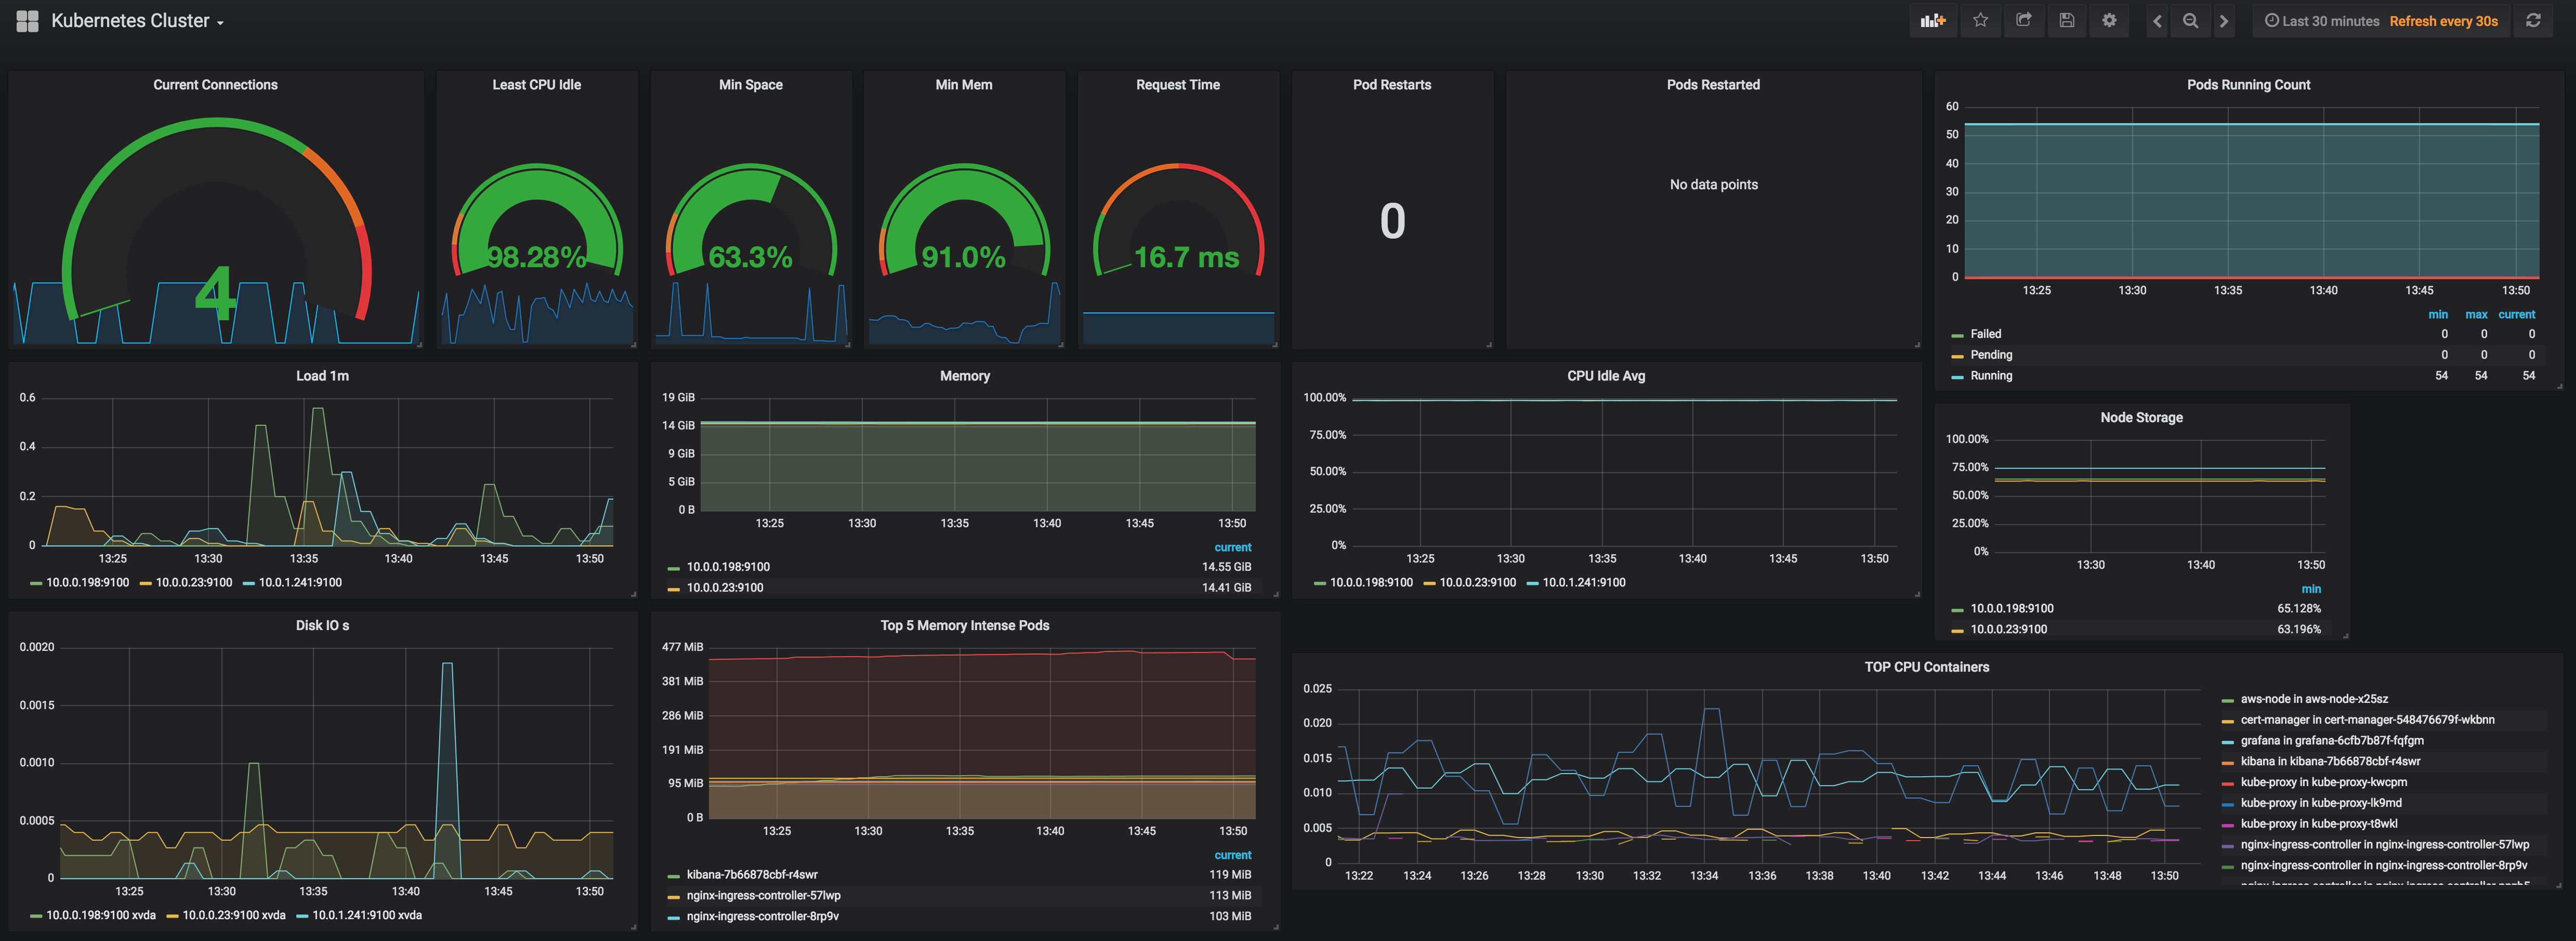
Cluster level overview of workloads deployed, based on prometheus metrics exposed by kubelet, node-exporter, nginx ingress controller
Updated from https://grafana.com/dashboards/4018 for use with
- Kubernetes v1.10.~
- Prometheus v2.3.1
- Prometheus Node Exporter v0.16.0
- Nginx Ingress Controller 0.15.0
- Kube State Metrics v1.3.1
Shows basic stuff about
- cluster health (pod status count, pod restarts etc.)
- cluster nodes (cpu, memory, storage etc.)
- running pods (cpu, memory etc.)
- nginx ingress controller (connections, resp time)
intended for a starting point for looking at and debugging cluster health / performance
Data source config
Collector type:
Collector plugins:
Collector config:
Revisions
Upload an updated version of an exported dashboard.json file from Grafana
| Revision | Description | Created | |
|---|---|---|---|
| Download |
Kubernetes
Monitor your Kubernetes deployment with prebuilt visualizations that allow you to drill down from a high-level cluster overview to pod-specific details in minutes.
Learn more