Kubernetes Resource Requests
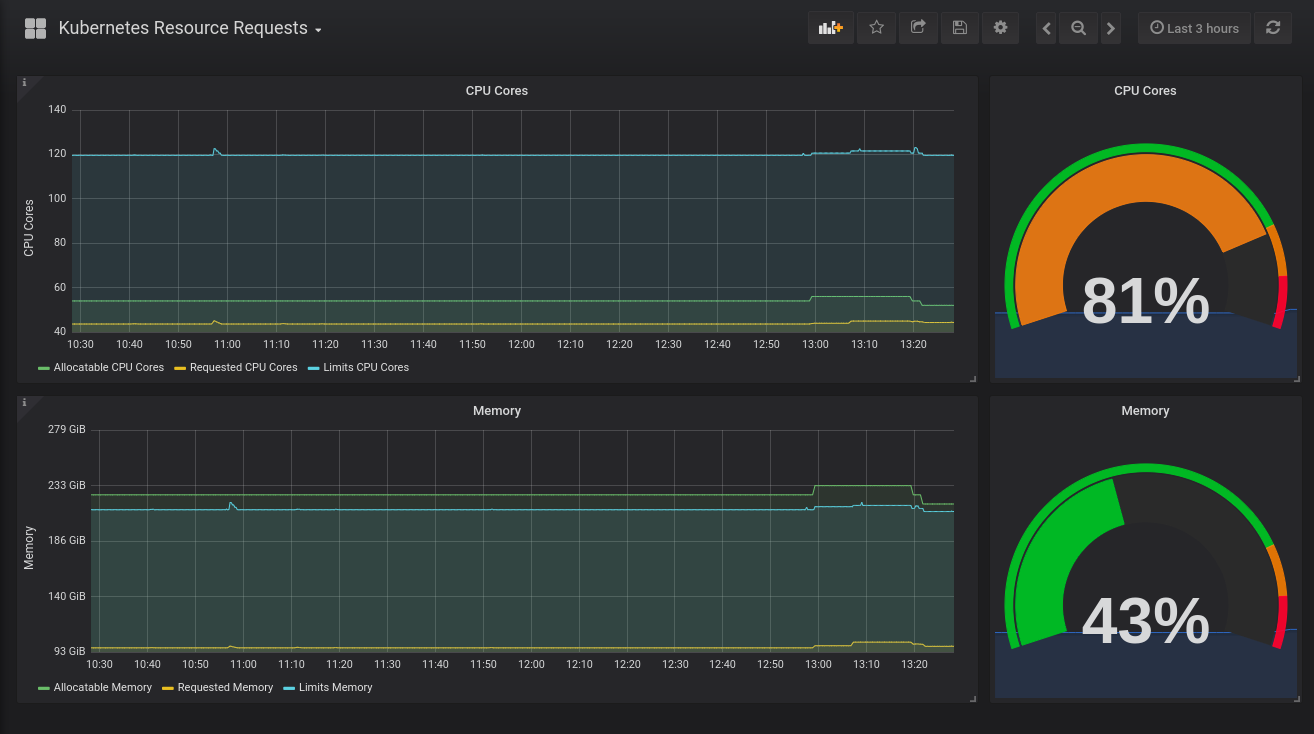
Dashboard to show the resource requests vs allocatable in the cluster
Kubernetes-resource-requests
This dashboards shows you the total allocatable CPU/Memory for the cluster (information from the nodes) and the CPU/Memory pod request and limits set in each pod.
This is helpful information to let you know how much was requested and what the limits of the CPU/Memory are. You can use this information to help you plan to scale out the cluster or to view how efficiently the cluster is being used.
Original source: https://grafana.com/dashboards/3149
Modified and added in:
- cpu/memory pod limits to the charts
Data source config
Collector config:
Upload an updated version of an exported dashboard.json file from Grafana
| Revision | Description | Created | |
|---|---|---|---|
| Download |
Kubernetes
Monitor your Kubernetes deployment with prebuilt visualizations that allow you to drill down from a high-level cluster overview to pod-specific details in minutes.
Learn more