Minio
minio dashboard
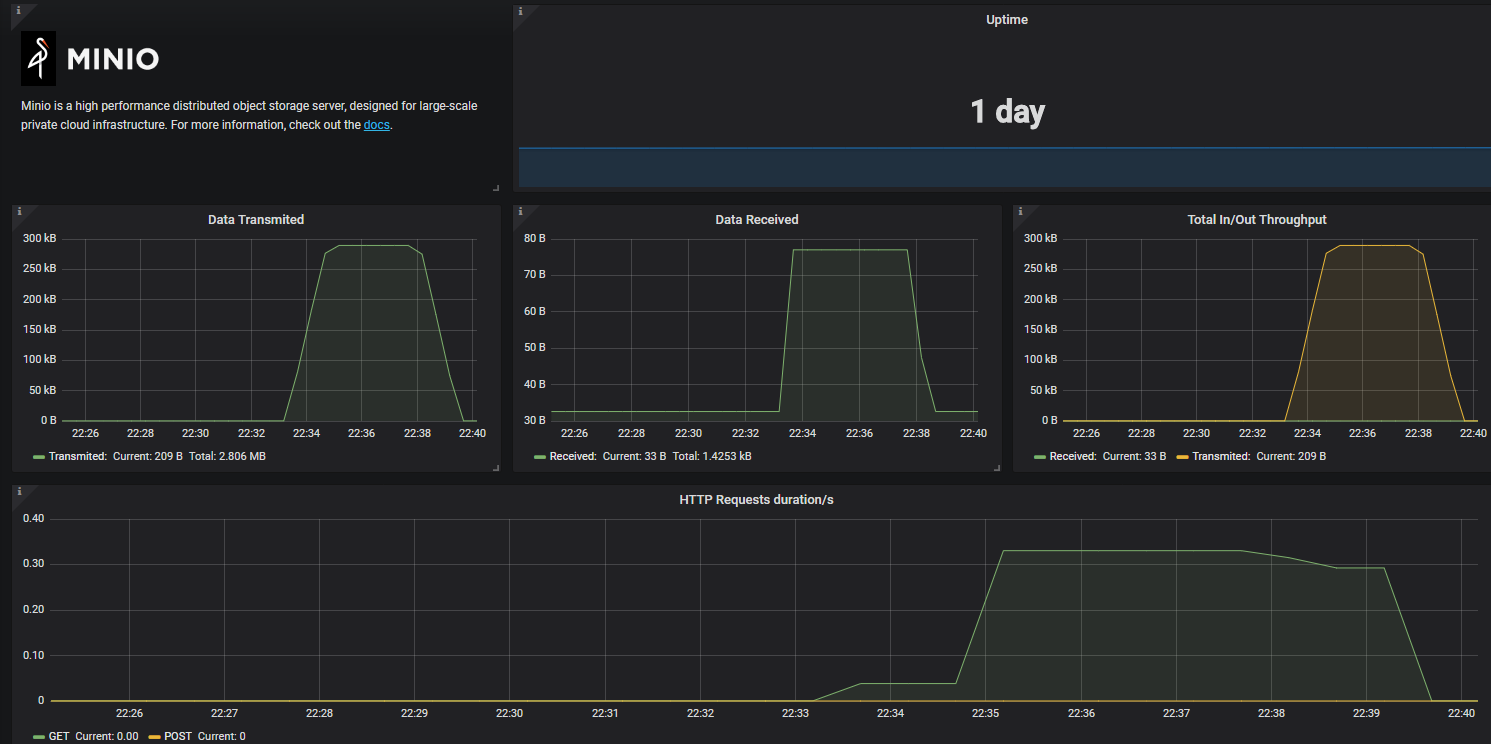
A simple dashboard to monitor Minio Server.
provide your feedback on: https://github.com/amenezes/grafana-dashboards/issues
prometheus.yml configuration:
  - job_name: minio
    metrics_path: /minio/prometheus/metrics
    scrape_interval: 10s
    static_configs:
    - targets:
      - <your_minio_server>:9000
- require minio server version: RELEASE.2018-05-11T00-29-24Z or later.
Data source config
Collector type:
Collector plugins:
Collector config:
Revisions
Upload an updated version of an exported dashboard.json file from Grafana
| Revision | Description | Created | |
|---|---|---|---|
| Download |
MinIO
Easily monitor Minio, a Kubernetes-native high-performance object storage server, with Grafana Cloud's out-of-the-box monitoring solution.
Learn more