
Spring Boot HikariCP / JDBC
HikariCP & JDBC Dashboard (Micrometer.io)
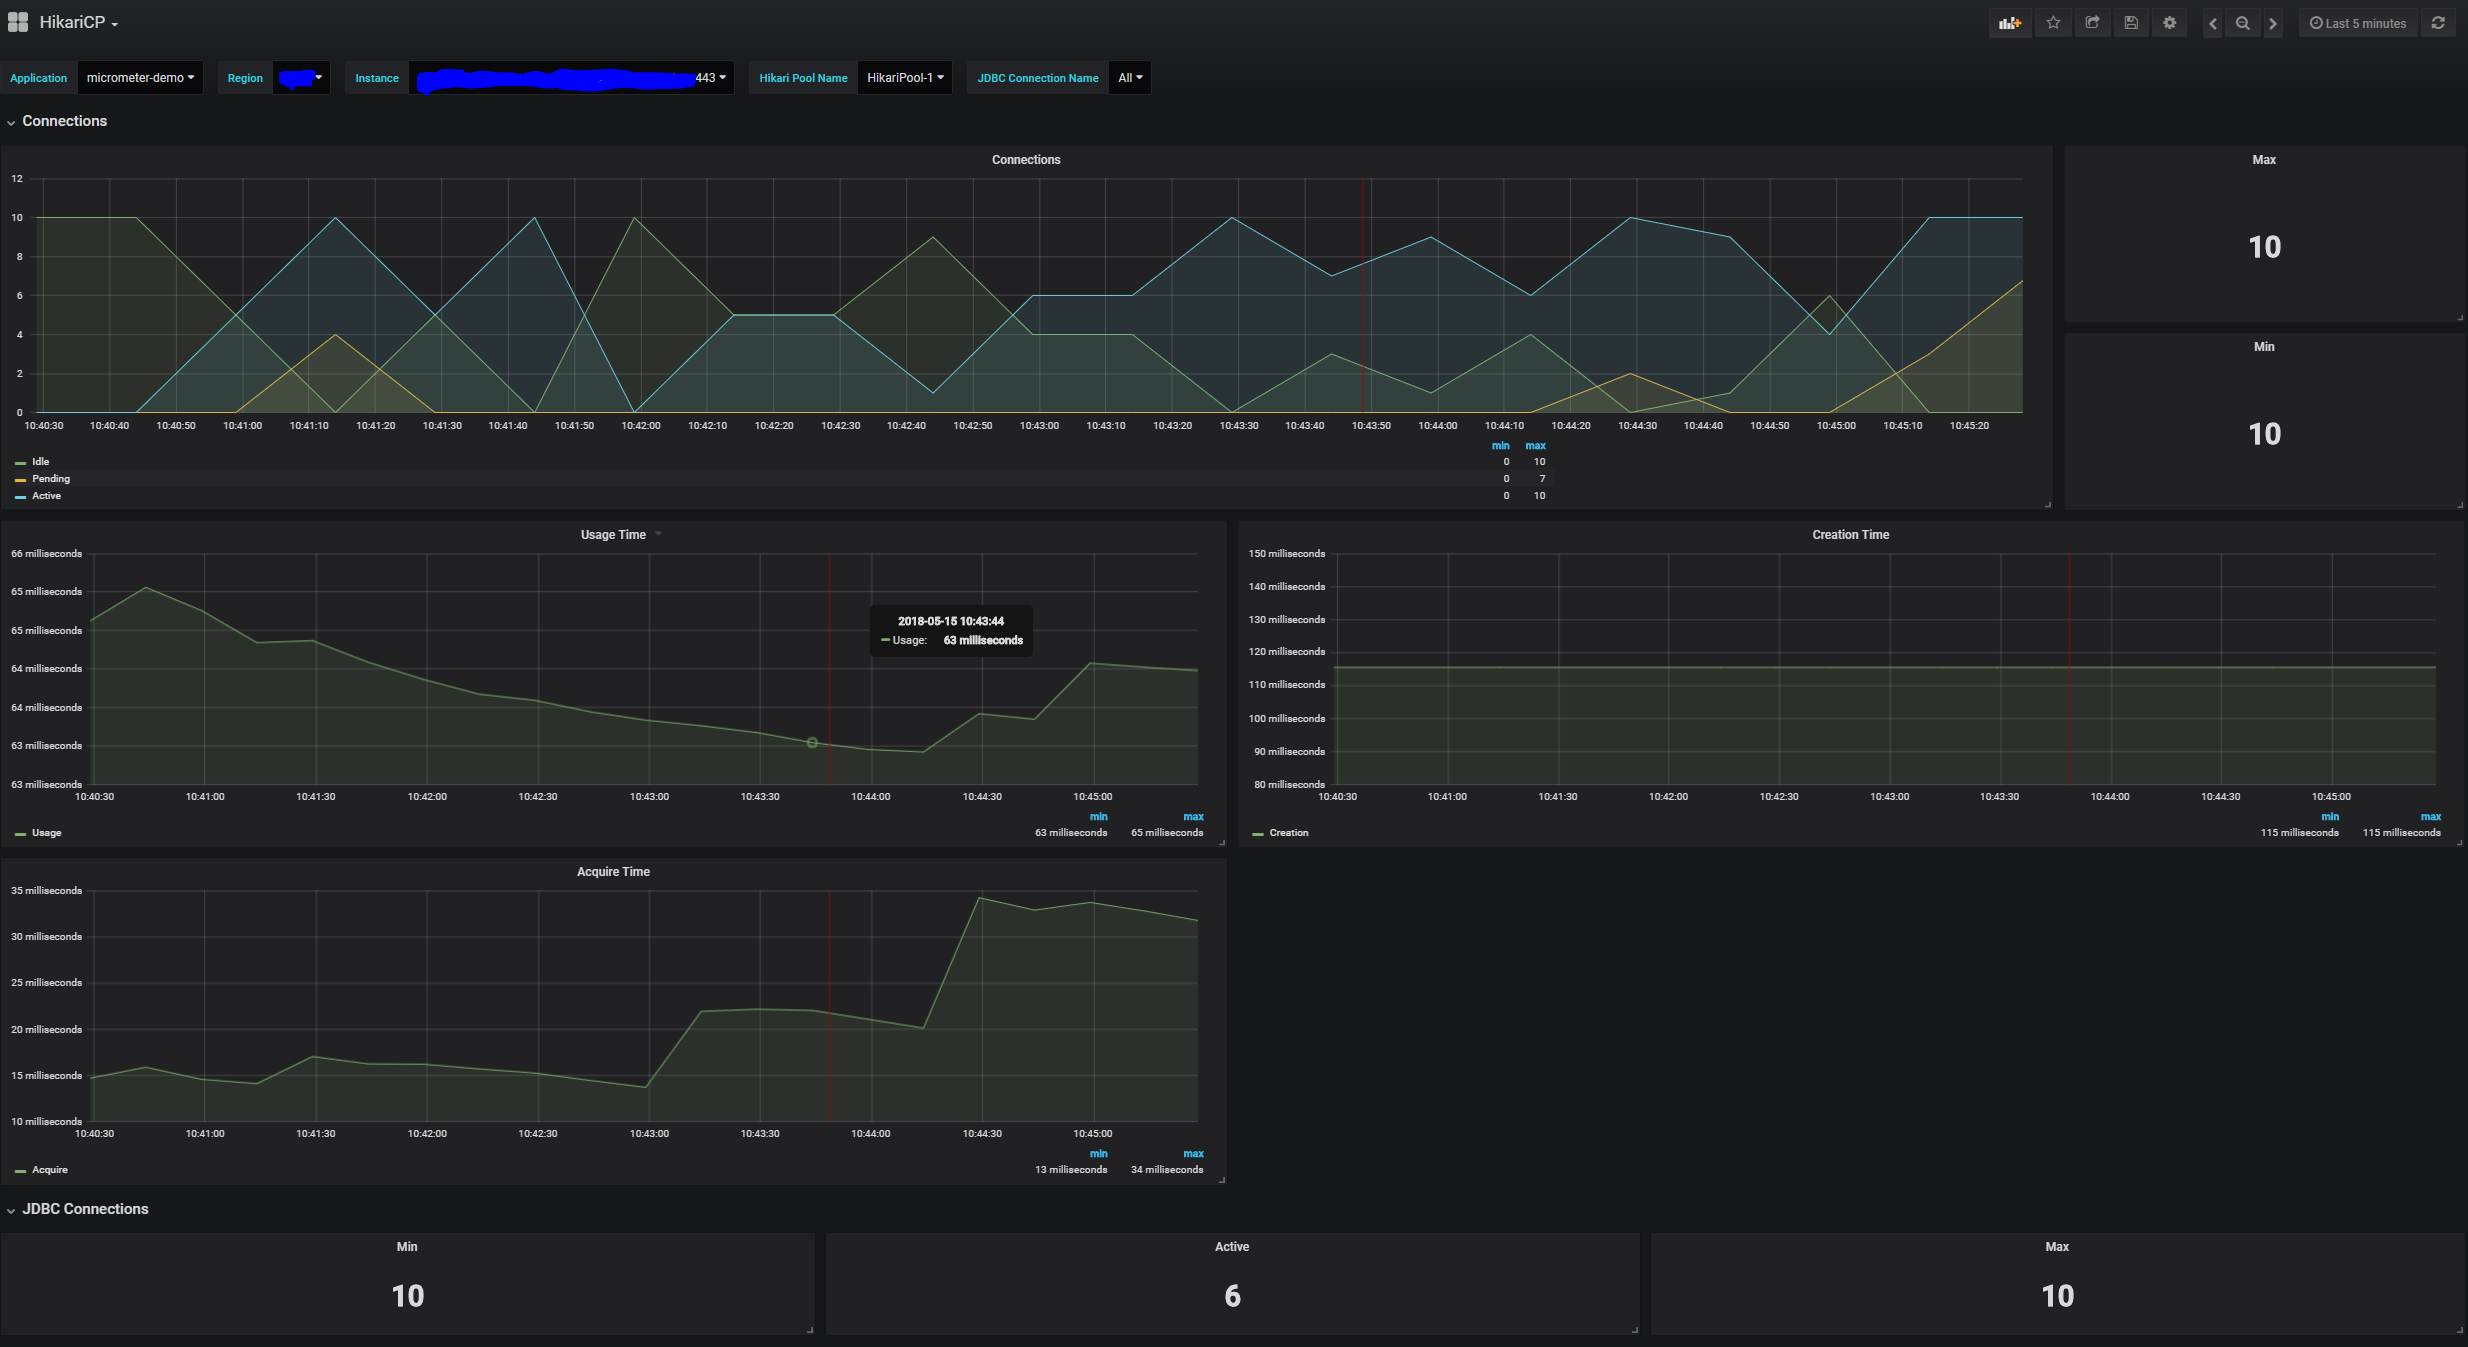
Spring Boot HikariCP / JDBC dashboard will display the metrics from micrometer. You can setup the application name and the region in your Spring Boot app with the properties:
spring:
  application:
    name: my-service
datasource:
hikari:
pool-name: custom-pool-name     # optional
management:
endpoints:
web:
exposure:
include: ["*"]    # customize to your need
metrics:
tags:
application: ${spring.application.name}
region: my-region
Updated for Spring Boot 2.1.x
Data source config
Collector type:
Collector plugins:
Collector config:
Revisions
Upload an updated version of an exported dashboard.json file from Grafana
| Revision | Description | Created | |
|---|---|---|---|
| Download |
Spring Boot
Easily monitor Spring Boot with Grafana Cloud's out-of-the-box monitoring solution.
Learn more