Telegraf - system metrics
InfluxDB dashboards for telegraf metrics
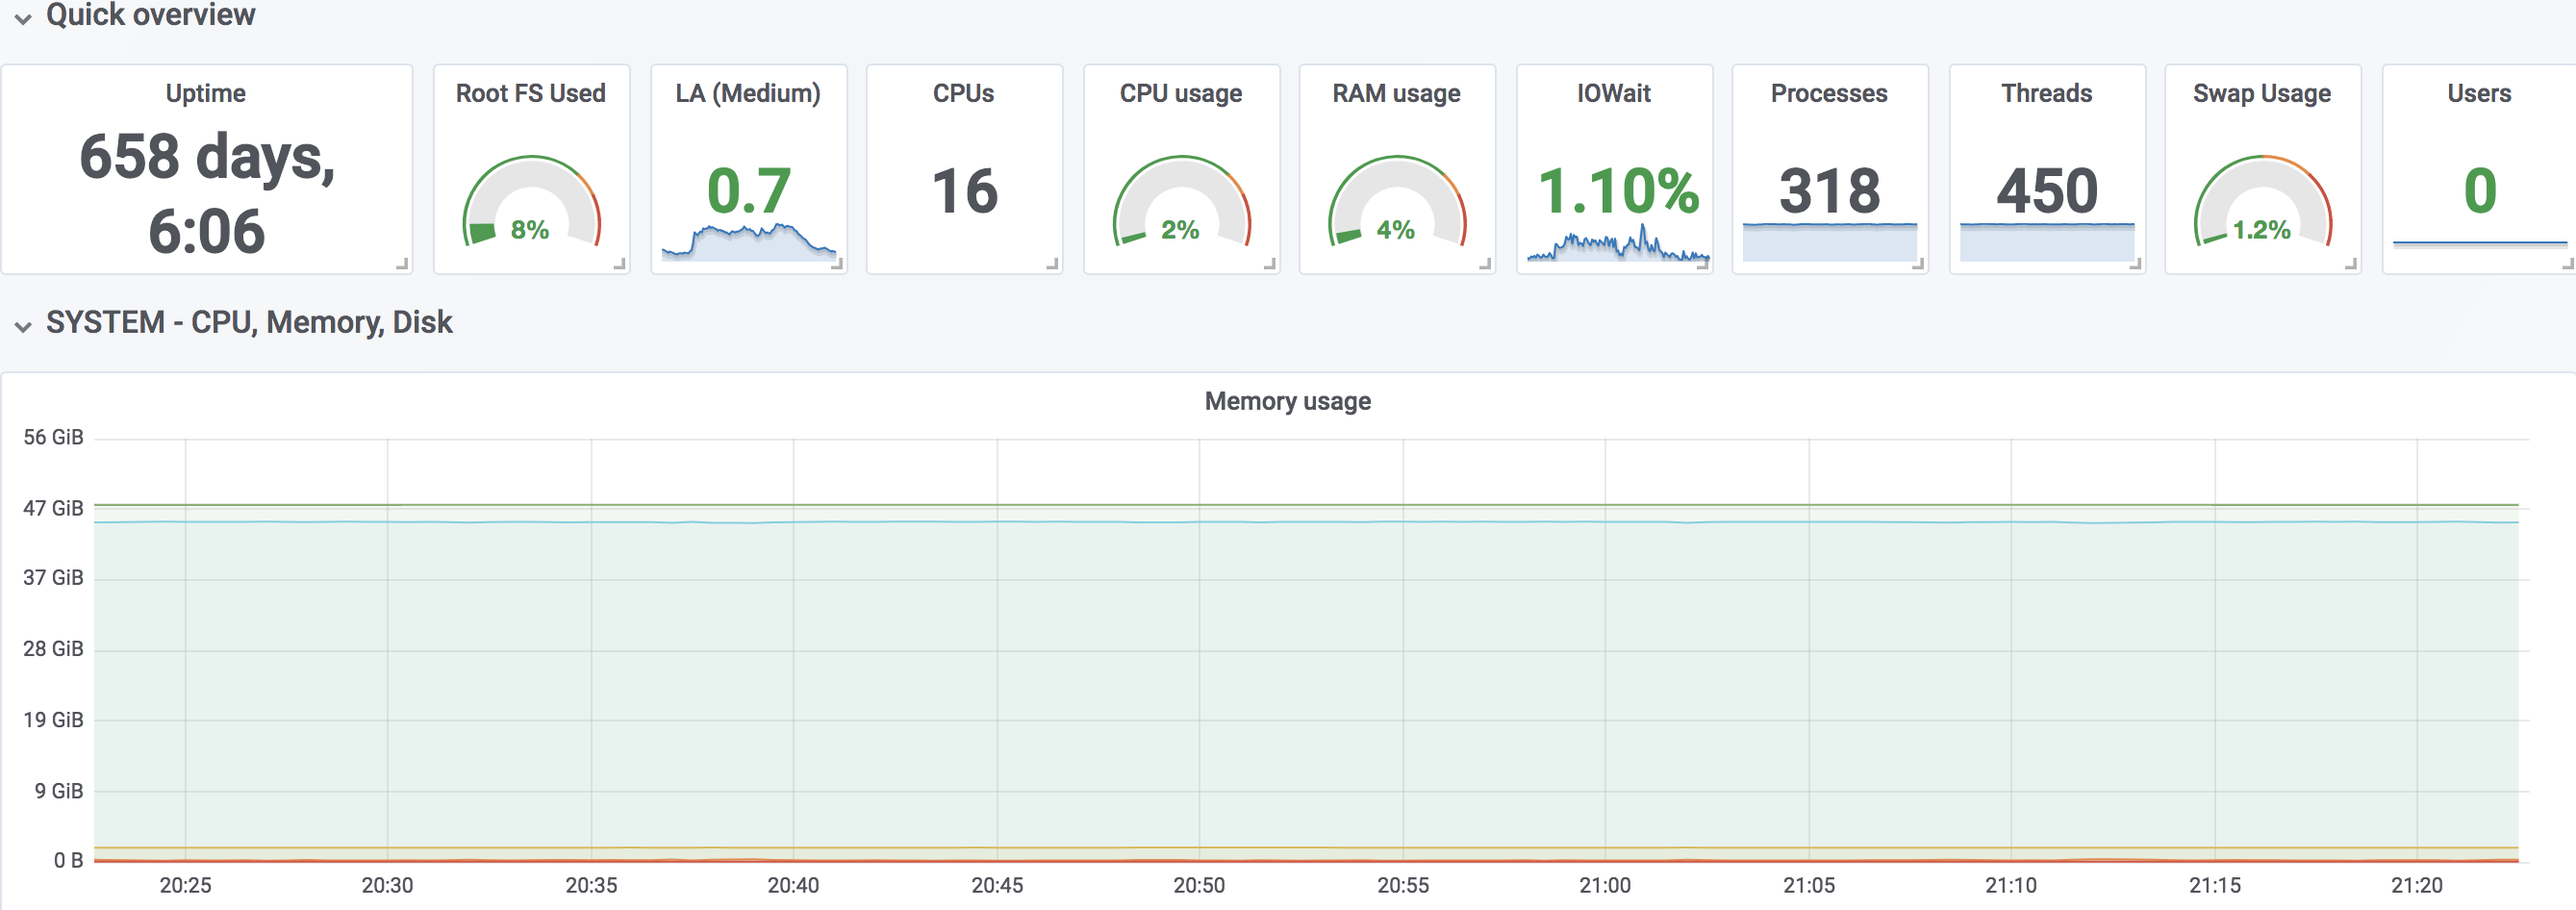
This Grafana dashboard uses templating with a number of variables defined.
You can visualize the following data from it:
- Server uptime
- Server memory utilization - Used, cached, free
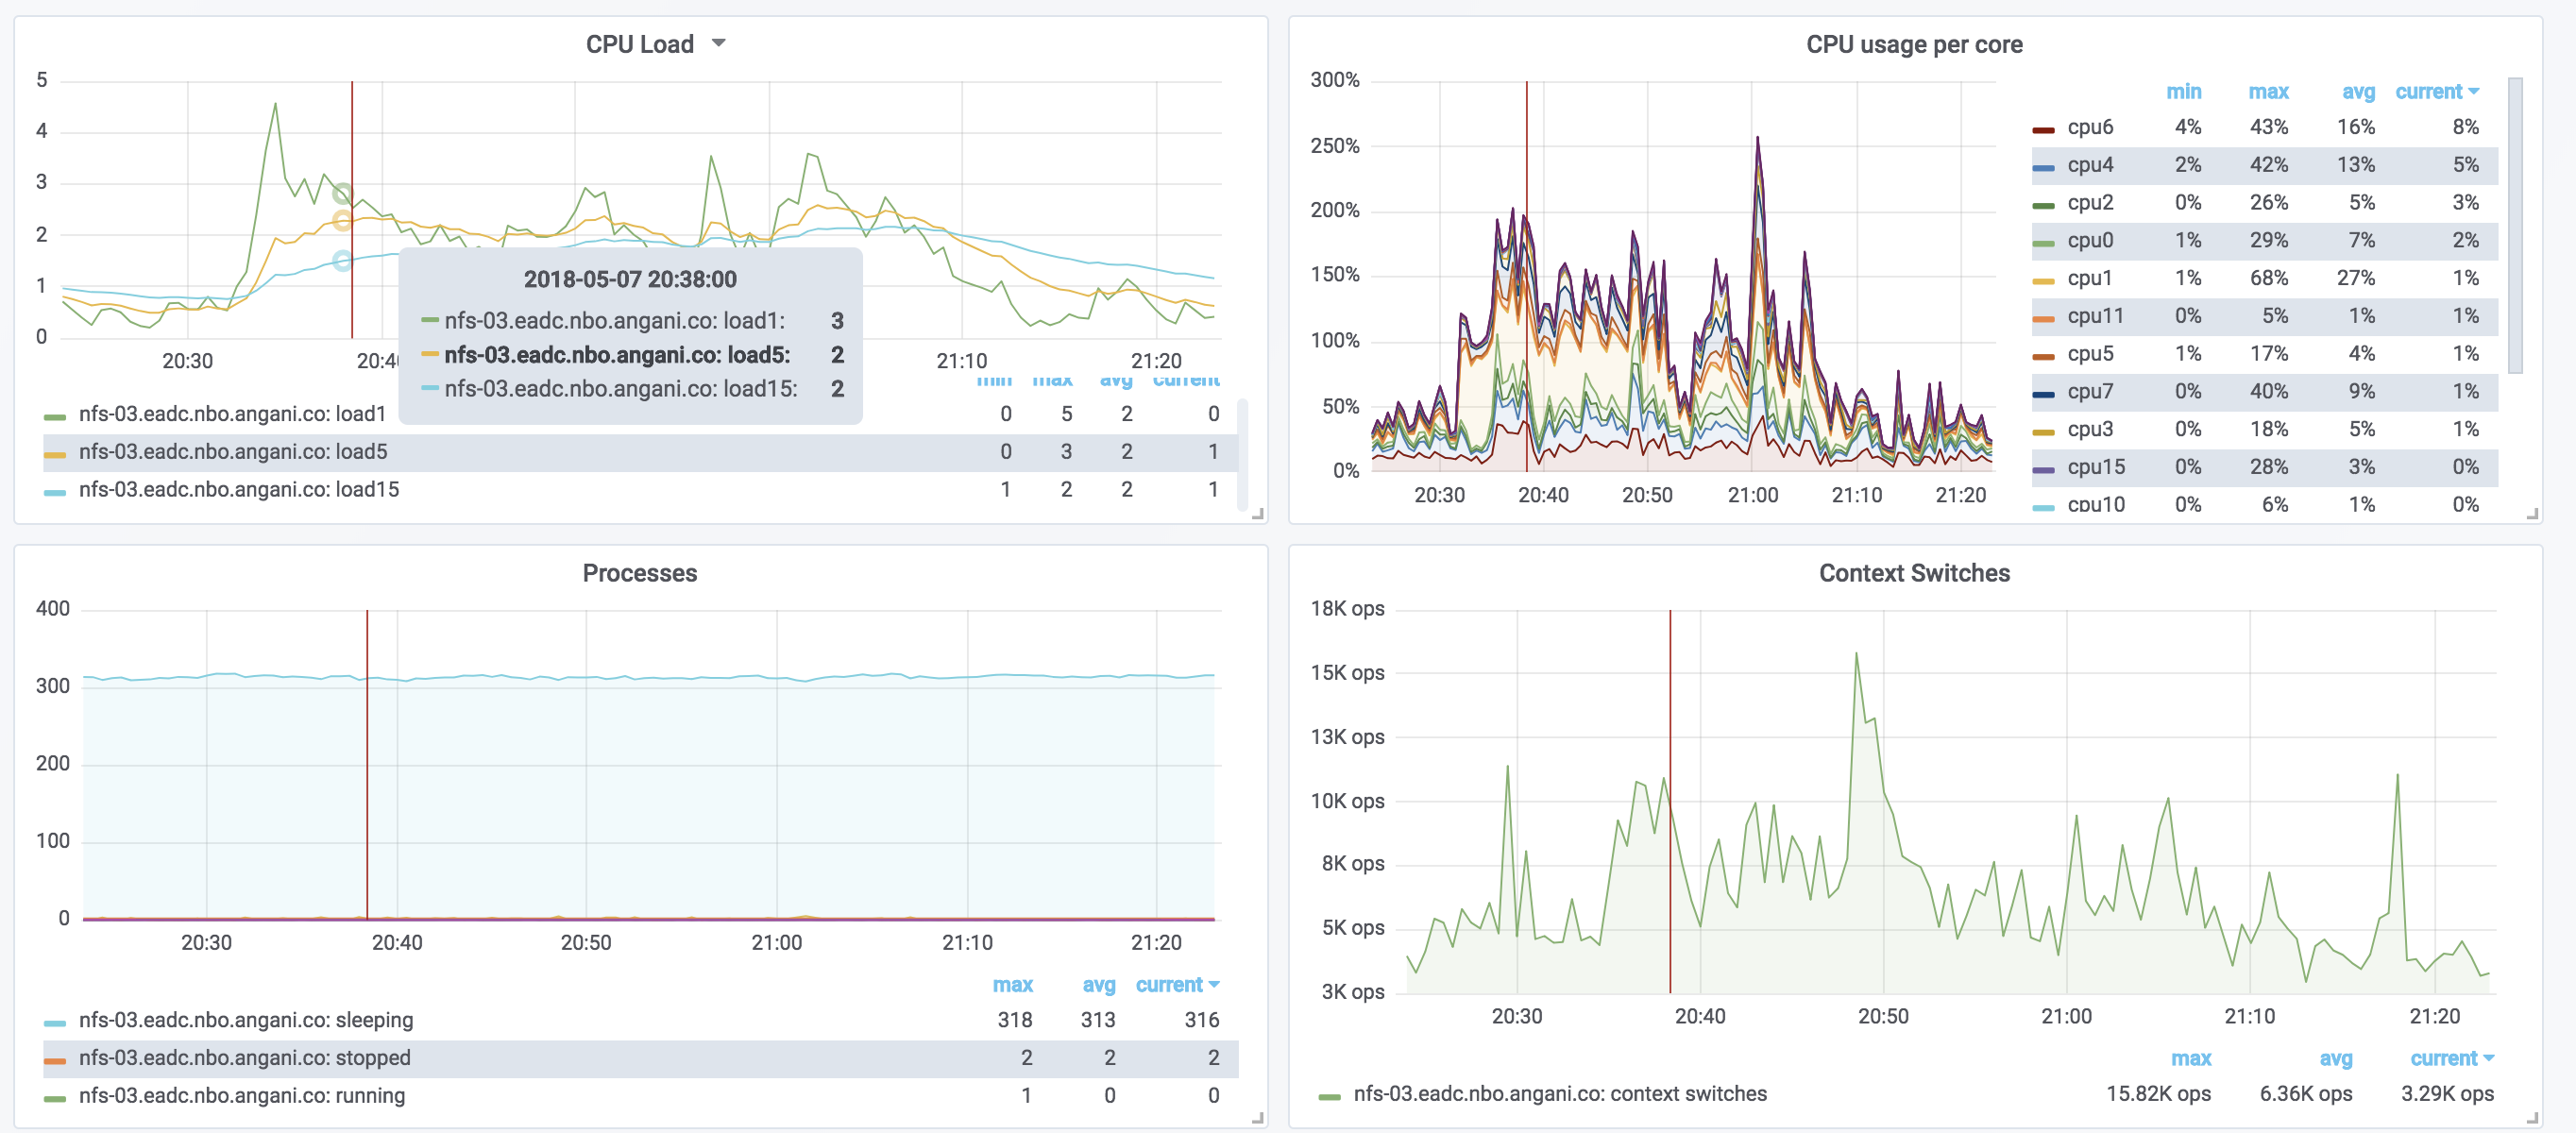
- Cpu utilization - Load average and usage
- Number of CPU cores and each cpu utilization
- Processes - stopped, sleeping, running e.t.c
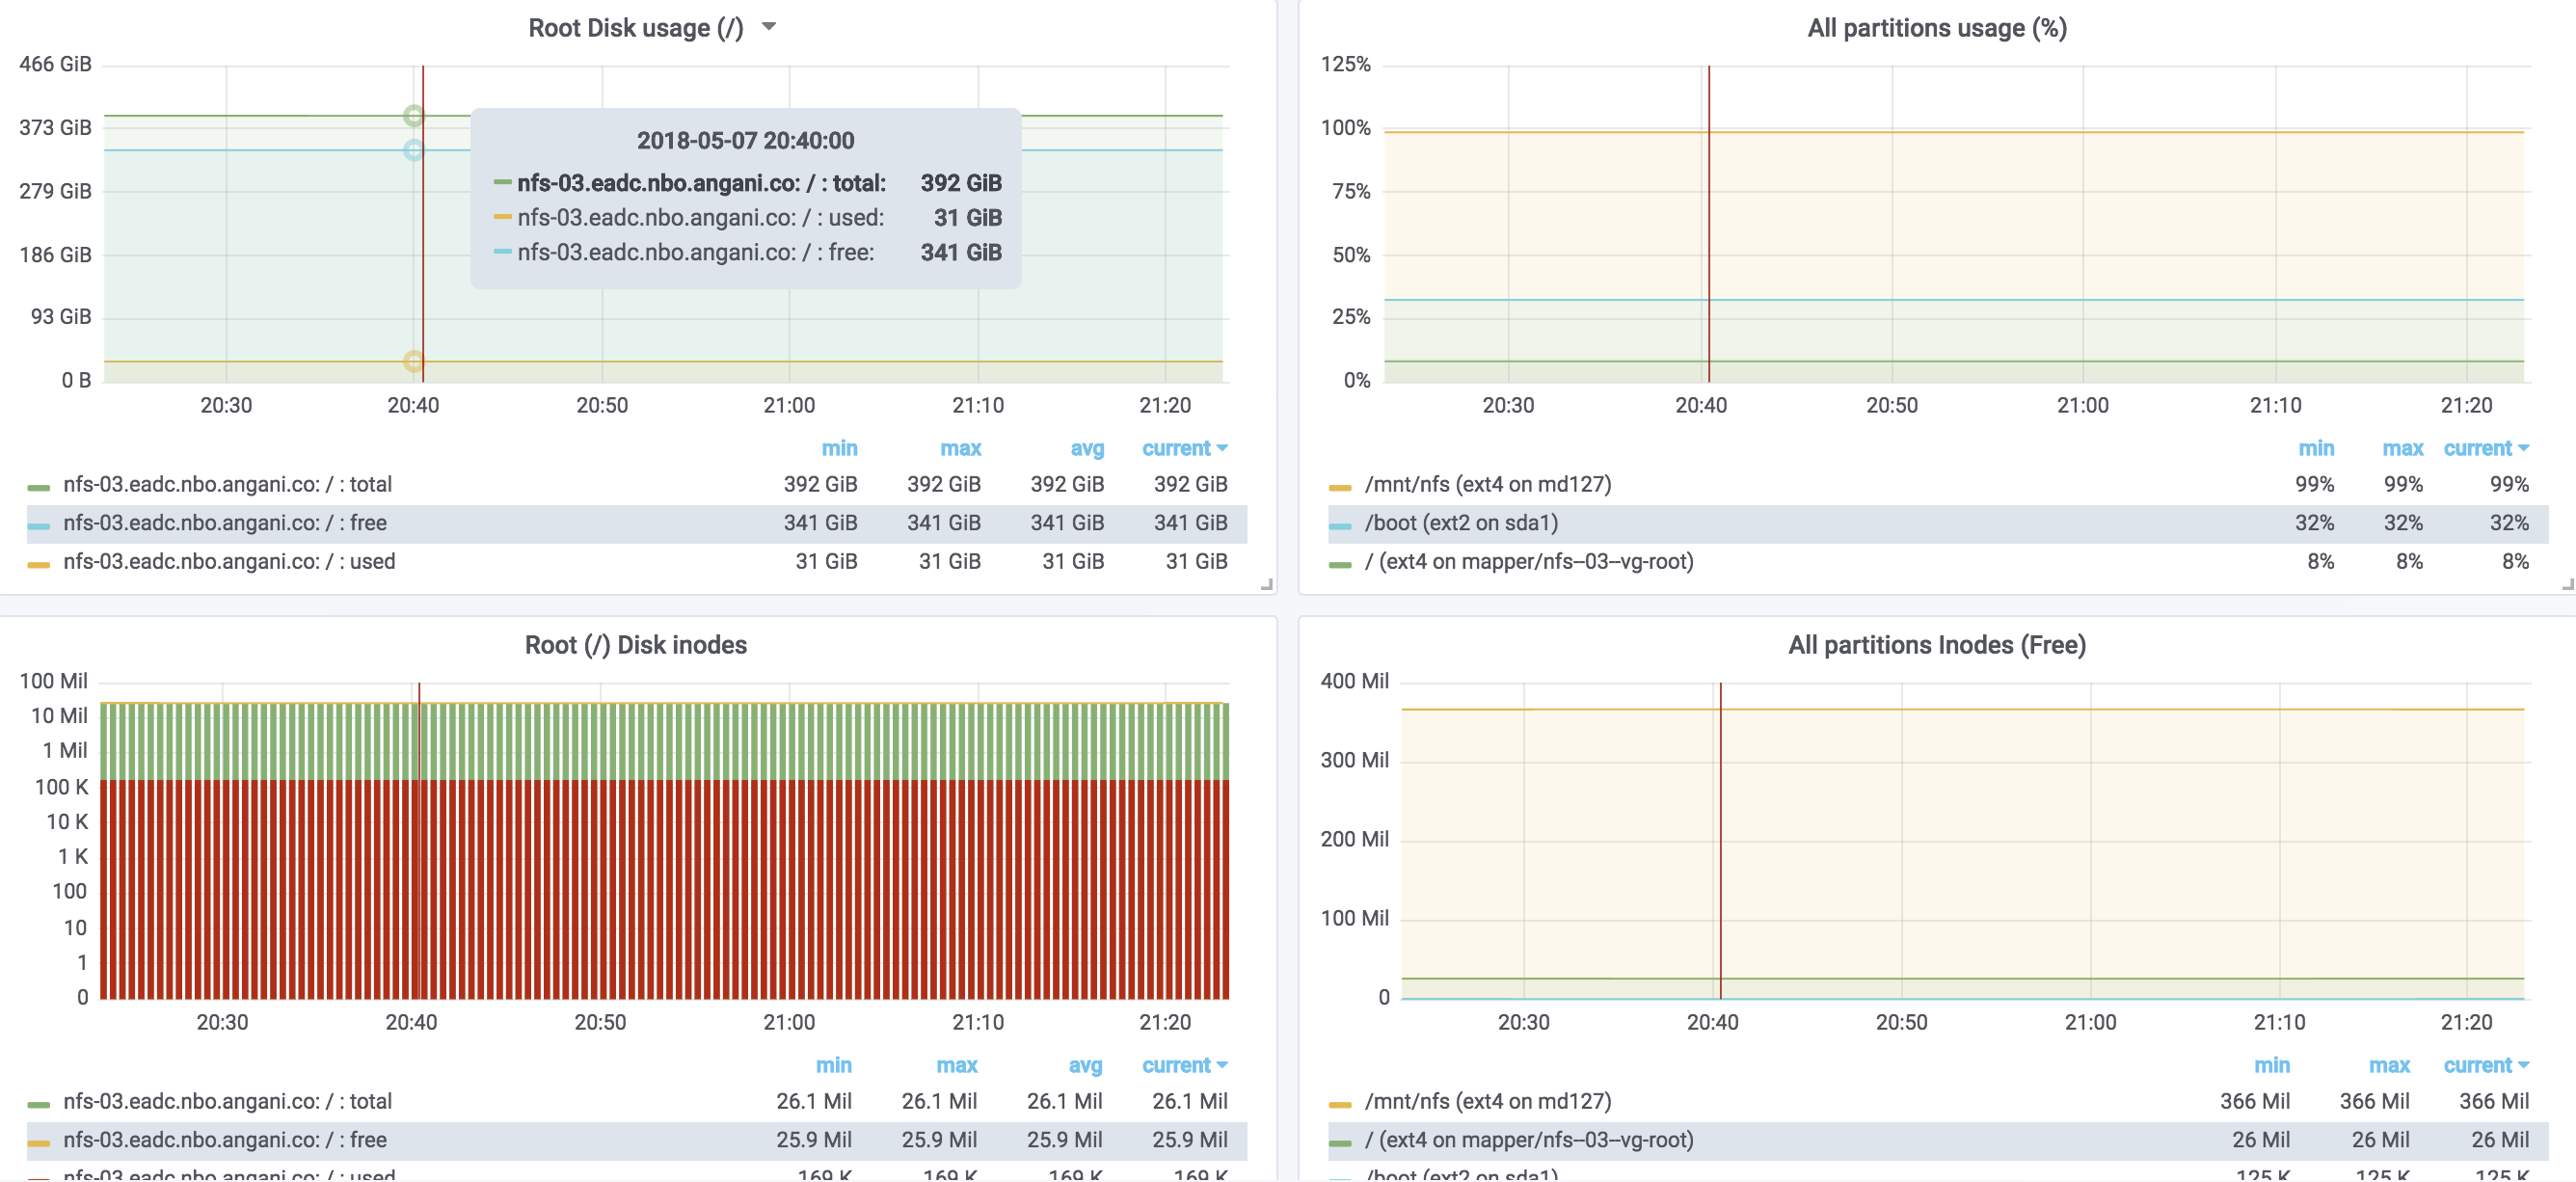
- Disk Utilization - Free and used space for / and all othe system partitions
- Disk Inodes - / and all othe partitions in the system
- Swap - usage and IO
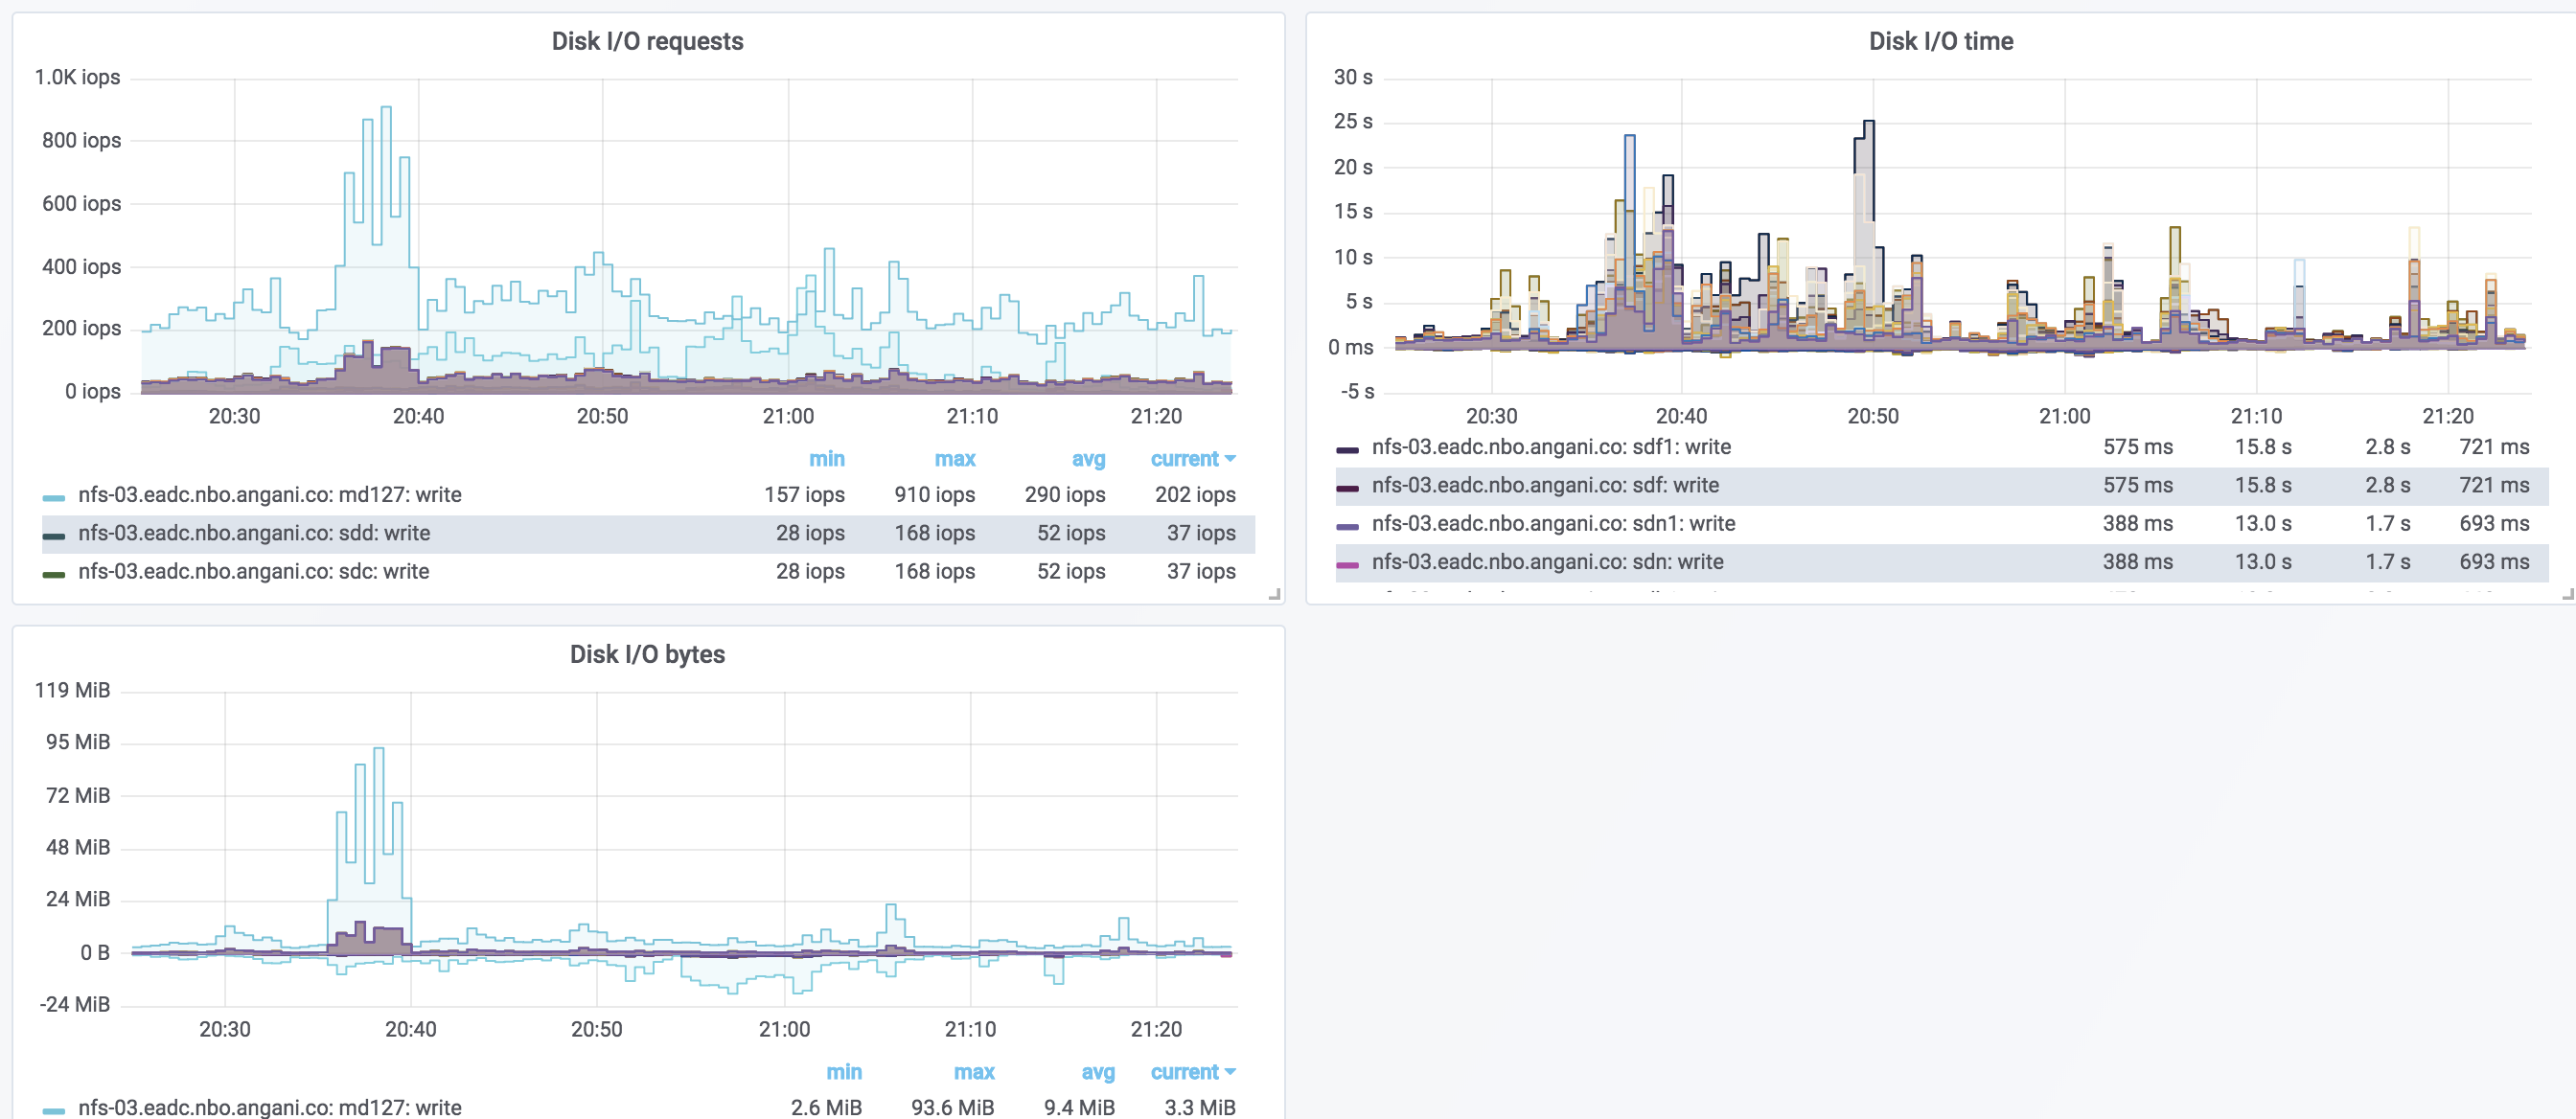
- Disk IO - requests, bytes and time
Data source config
Collector type:
Collector plugins:
Collector config:
Revisions
Upload an updated version of an exported dashboard.json file from Grafana
| Revision | Description | Created | |
|---|---|---|---|
| Download |