Nginx Stats
Nginx Stats Dashboard using CollectD and Graphite
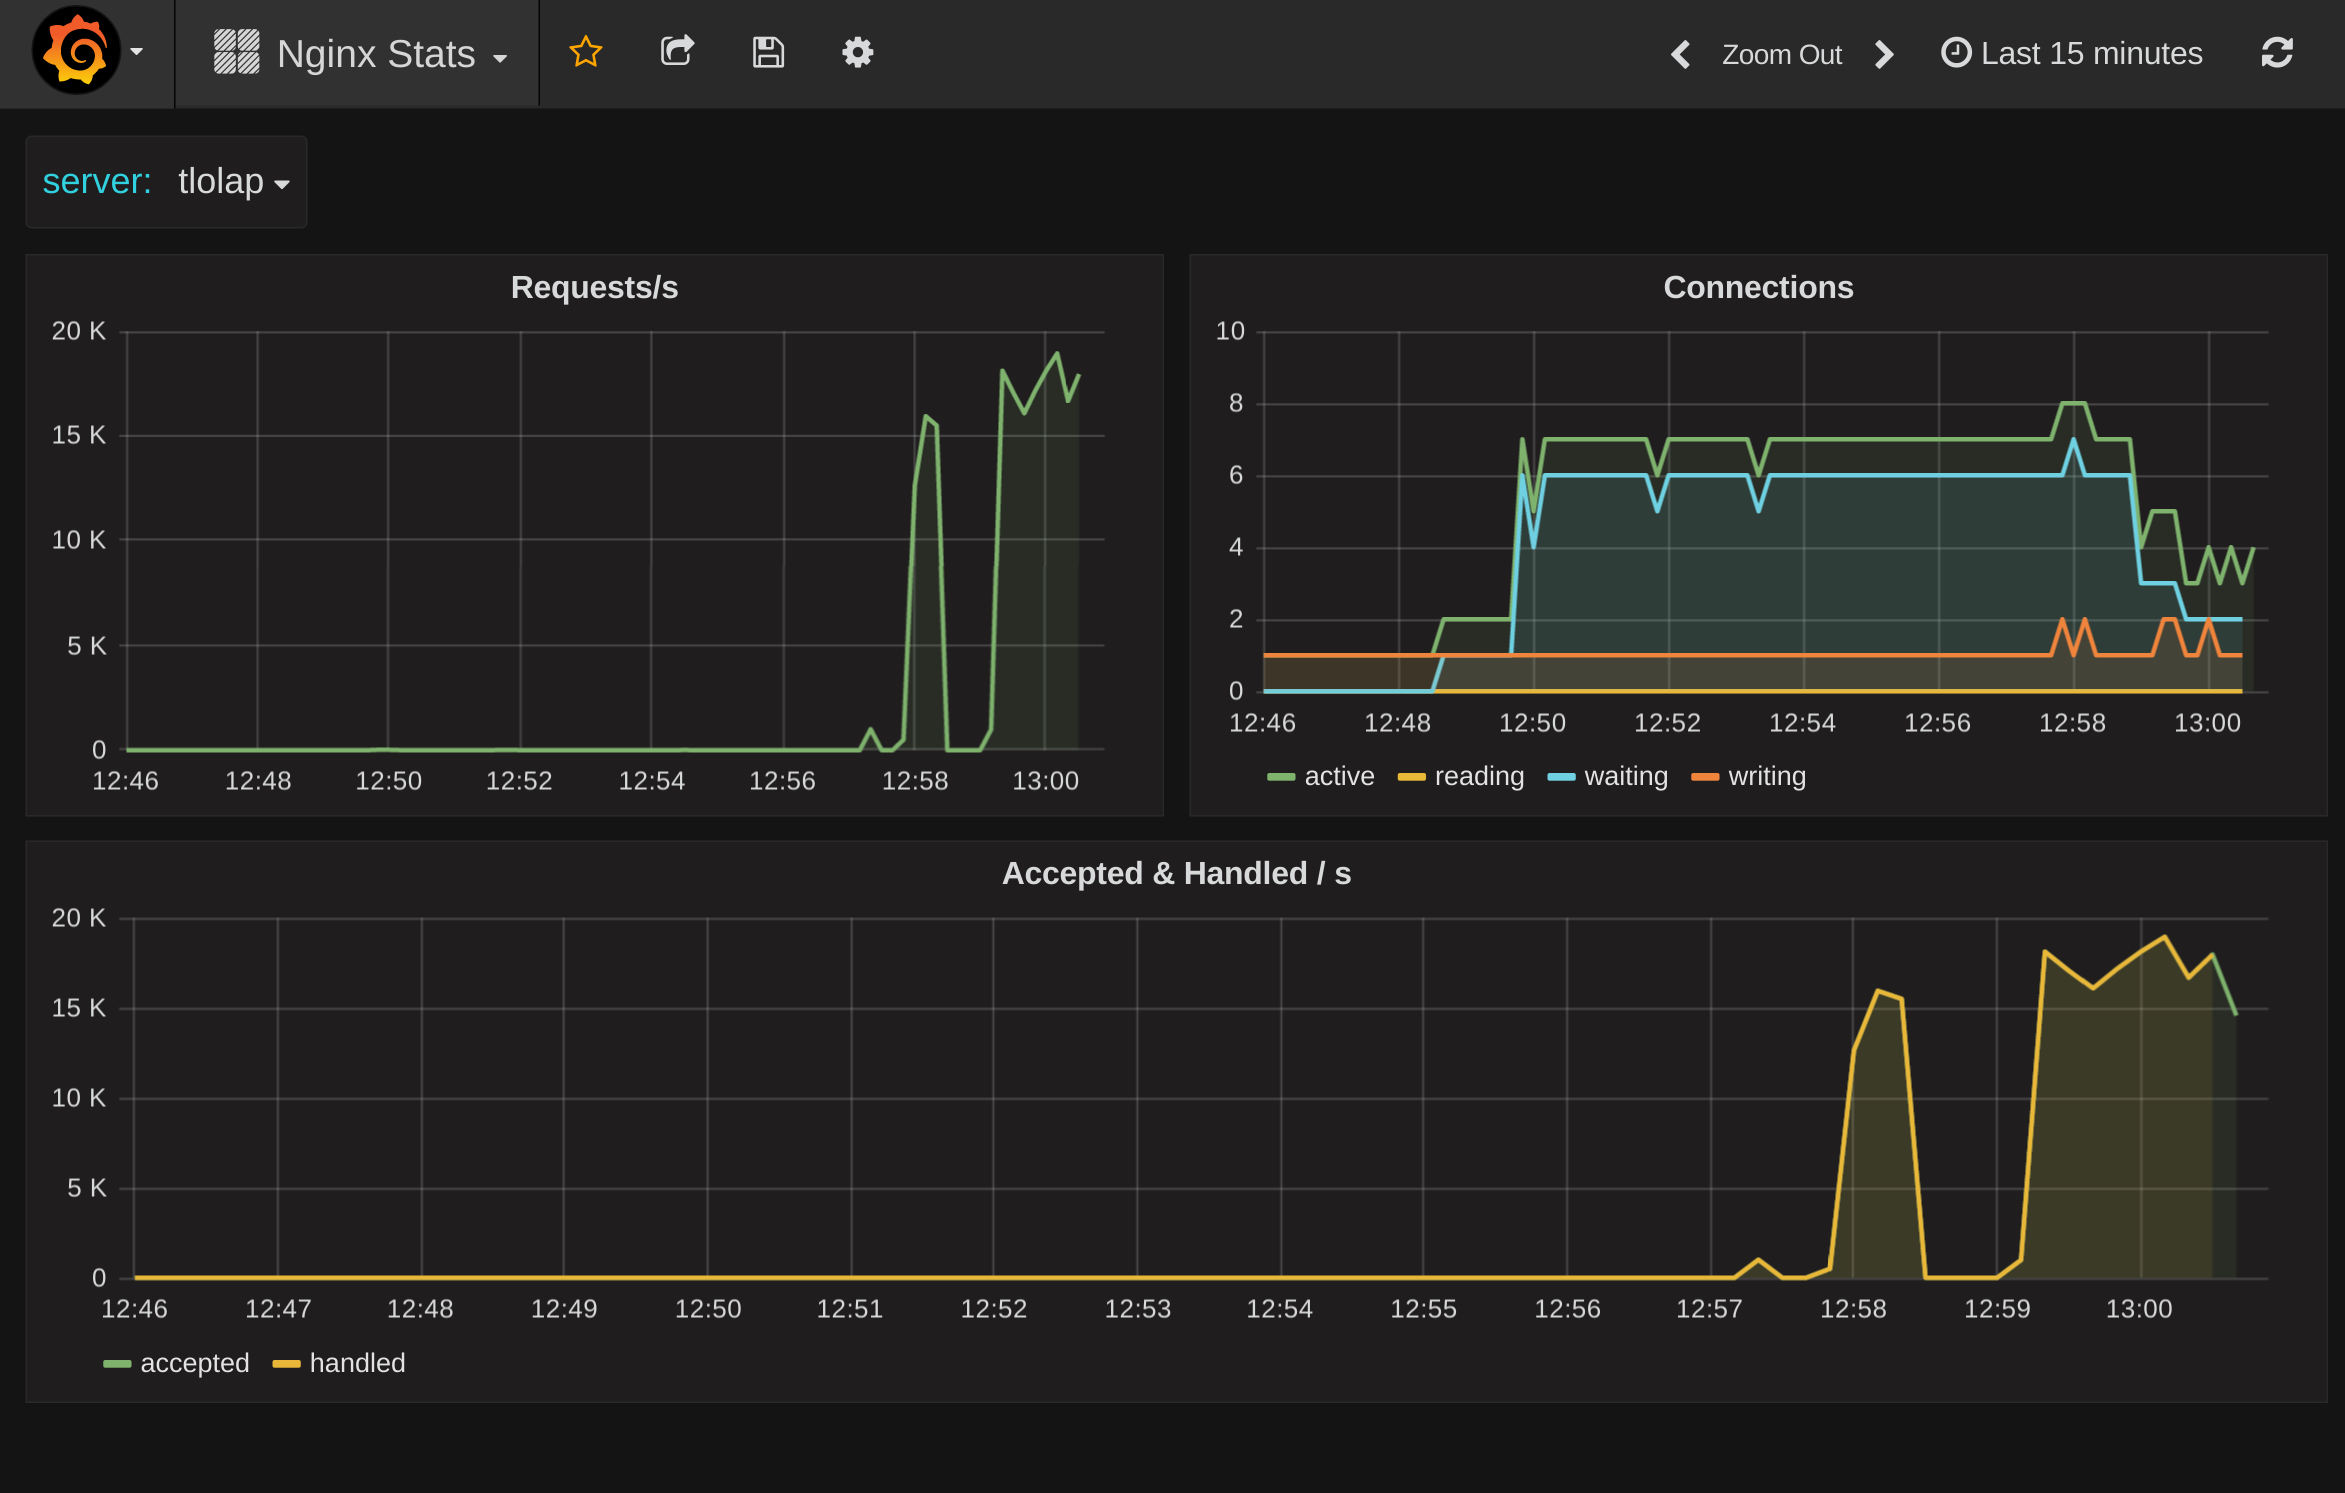
Basic Nginx Stats Dashboard.
Metrics shown
- Requests/s
- Connection state breakdown
- Connections handled vs accepted
Configure Nginx
You need to enable stub_status module in a location to make metrics available for collectd.
location /nginx_status {
    stub_status on;
    access_log off;
    allow 127.0.0.1;
    deny all;
}
Configure CollectD
The relevant parts for this dashboard is
LoadPlugin nginx
<Plugin "nginx">
    URL "http://localhost:8080/nginx_status"
</Plugin>
Metric Prefix
When you import the dasbhoard you will have to specify your collectd metric prefix, this is by defauilt just collectd. The dashboard assumes the following metric structure $prefix.$server.nginx.... So if you have a non standard collectd prefix like prod.cacheservers then specify that in the prefix field when you import the dashboard. During import when you specify the prefix do not include the last dot (.).
Make this dashboard better
For feedback and ideas to improve this dashboard please open an issue here: https://github.com/torkelo/dashboards
Data source config
Collector config:
Upload an updated version of an exported dashboard.json file from Grafana
| Revision | Description | Created | |
|---|---|---|---|
| Download |
NGINX
Easily monitor NGINX, an open source software for web serving, reverse proxying, caching, load balancing, media streaming, and more, with Grafana Cloud's out-of-the-box monitoring solution.
Learn more
