Kubernetes Container Stats
Summery metrics about containers running on Kubernetes nodes.
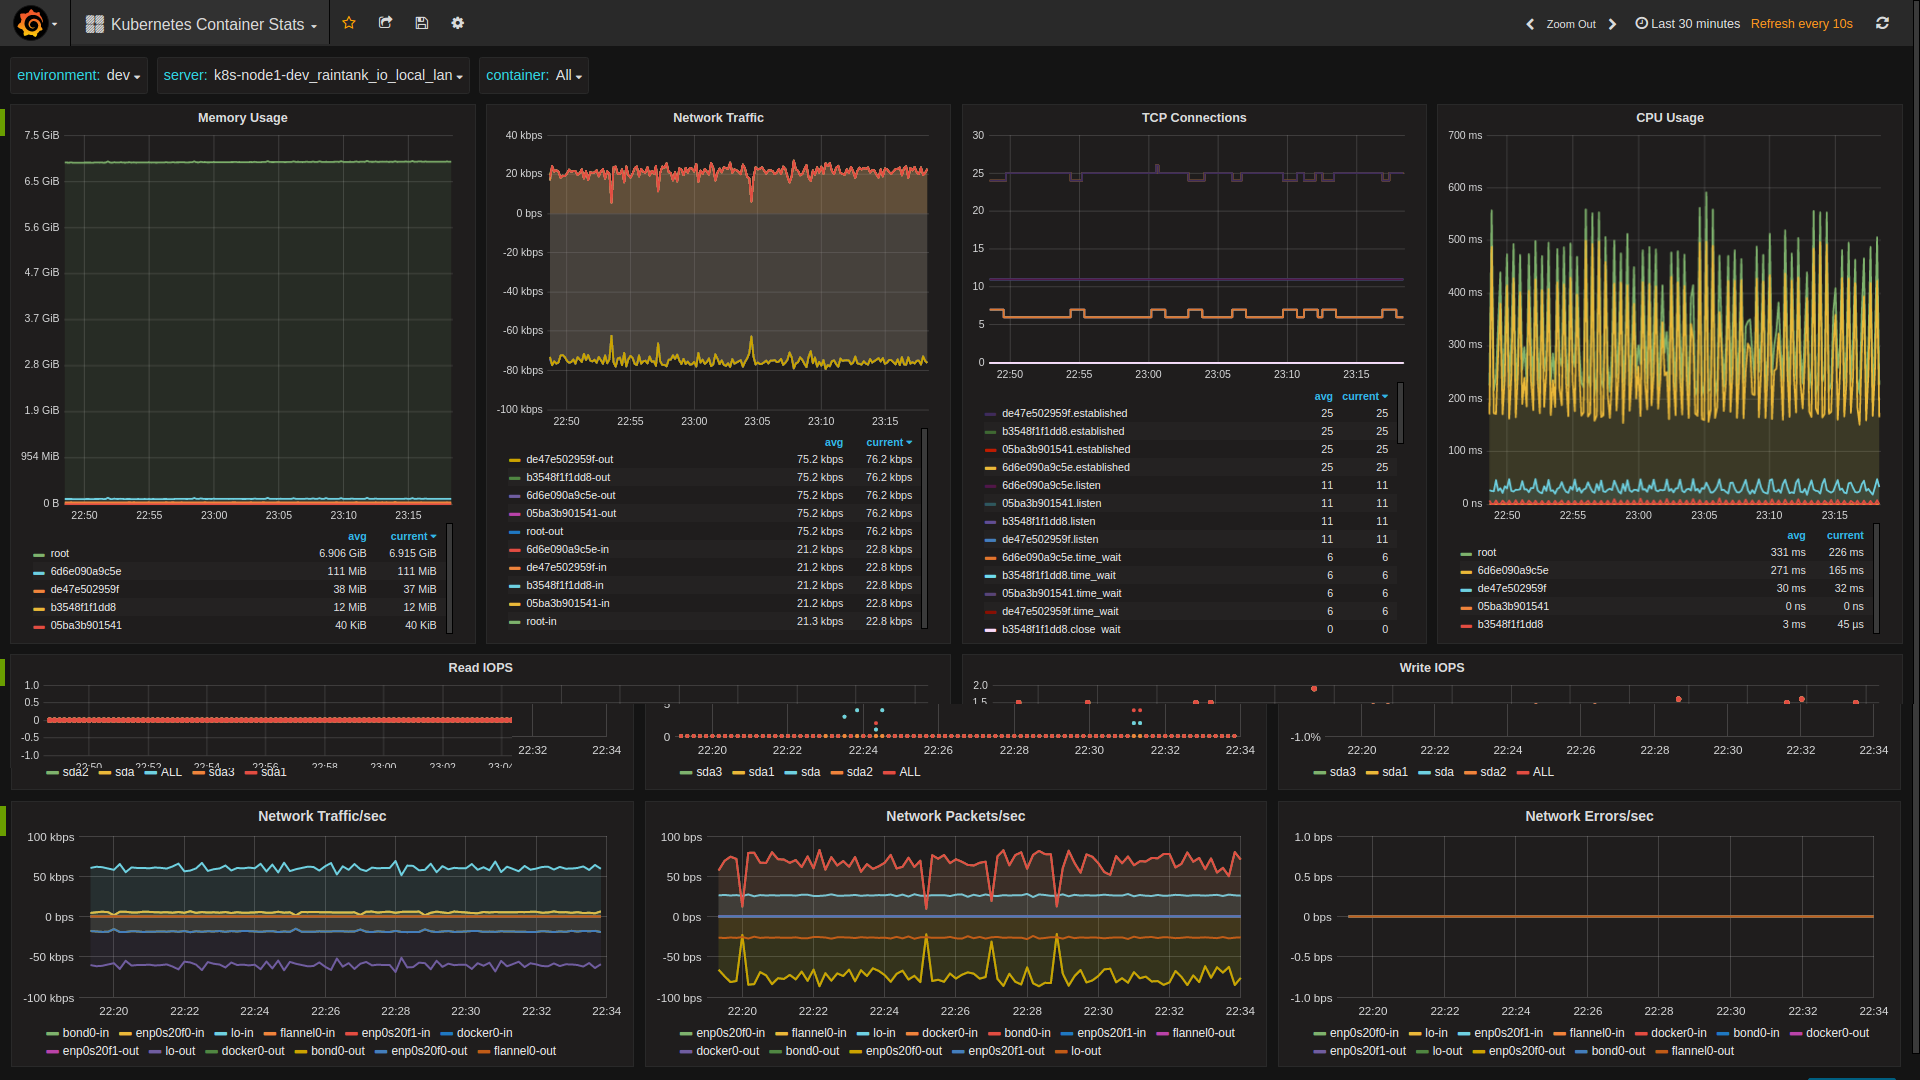
This dashboard provides summary performance and availability metrics of a Kubernetes Node. The data for this dashboard is expected to come from Snap agents running on every Kubernetes Node. This is best achieved by using the snap_k8s docker image available on docker hub.
To deploy the snap_k8s containers in your Kubernetes environment it is advised to use the following DaemonSet config.
apiVersion: extensions/v1beta1
kind: DaemonSet
metadata:
  name: snap
  namespace: kube-system
spec:
  template:
    metadata:
      name: snap
      labels:
        daemon: snapd
    spec:
      hostPID: true
      hostNetwork: true
      containers:
      - name: snap
        image: raintank/snap_k8s:v4
        volumeMounts:
          - mountPath: /sys/fs/cgroup
            name: cgroup
          - mountPath: /var/run/docker.sock
            name: docker-sock
          - mountPath: /var/lib/docker
            name: fs-stats
          - mountPath: /usr/local/bin/docker
            name: docker
          - mountPath: /proc_host
            name: proc
          - mountPath: /opt/snap/tasks
            name: snap-tasks
        ports:
        - containerPort: 8181
          hostPort: 8181
          name: snap-api
        imagePullPolicy: IfNotPresent
        securityContext:
          privileged: true
        env:
          - name: PROCFS_MOUNT
            value: /proc_host
      volumes:
        - name: dev
          hostPath:
            path: /dev
        - name: cgroup
          hostPath:
            path: /sys/fs/cgroup
        - name: docker-sock
          hostPath:
            path: /var/run/docker.sock
        - name: fs-stats
          hostPath:
            path: /var/lib/docker
        - name: docker
          hostPath:
            path: /usr/bin/docker
        - name: proc
          hostPath:
            path: /proc
        - name: snap-tasks
          configMap:
            name: snap-tasks
---
apiVersion: v1
kind: ConfigMap
metadata:
  name: snap-tasks
  namespace: kube-system
data:
  core.json: |-
    {
        "version": 1,
        "schedule": {
            "type": "simple",
            "interval": "10s"
        },
        "workflow": {
            "collect": {
                "metrics": {
                    "/intel/docker/*":{},
                    "/intel/procfs/cpu/*": {},
                    "/intel/procfs/meminfo/*": {},
                    "/intel/procfs/iface/*": {},
                    "/intel/linux/iostat/*": {},
                    "/intel/procfs/load/*": {}
                },
                "config": {
                    "/intel/procfs": {
                        "proc_path": "/proc_host"
                    }
                },
                "process": null,
                "publish": [
                    {
                        "plugin_name": "graphite",
                        "config": {
                            "prefix": "snap.dev.<%NODE%>",
                            "server": "graphite.local",
                            "port": 2003
                        }
                    }
                ]
            }
        }
    }
The only section that you should change is the graphite config.
- The server and port should be that of your Graphite server.
- The prefix will be inserted at the start of every metric produced by snap. For this dashboard the prefix is expected to be in the format "snap.." , where is something like "dev", "qa" or "prod" and is the hostname of the Kubernetes node. When using the snap_k8s docker image the literal string "<%NODE%>" can be used in the prefix and it will be replaced with the slugified representation of the hostname that the container is running on. So if the hostname was "k8s-node1.dev.raintank.io" <%NODE%> would be replaced with "k8s-node1_dev_raintank_io".
Simply write the kubernetes DaemonSet and ConfigMap to a file name snap_ds.yaml, then run
kubectl create -f snap_ds.yaml
Data source config
Collector config:
Upload an updated version of an exported dashboard.json file from Grafana
| Revision | Description | Created | |
|---|---|---|---|
| Download |
Kubernetes
Monitor your Kubernetes deployment with prebuilt visualizations that allow you to drill down from a high-level cluster overview to pod-specific details in minutes.
Learn more