JVM (Micrometer)
Dashboard for Micrometer instrumented applications (Java, Spring Boot, Micronaut)
JVM (Micrometer)
A dashboard for Micrometer instrumented applications (Java, Spring Boot, Micronaut).
Features
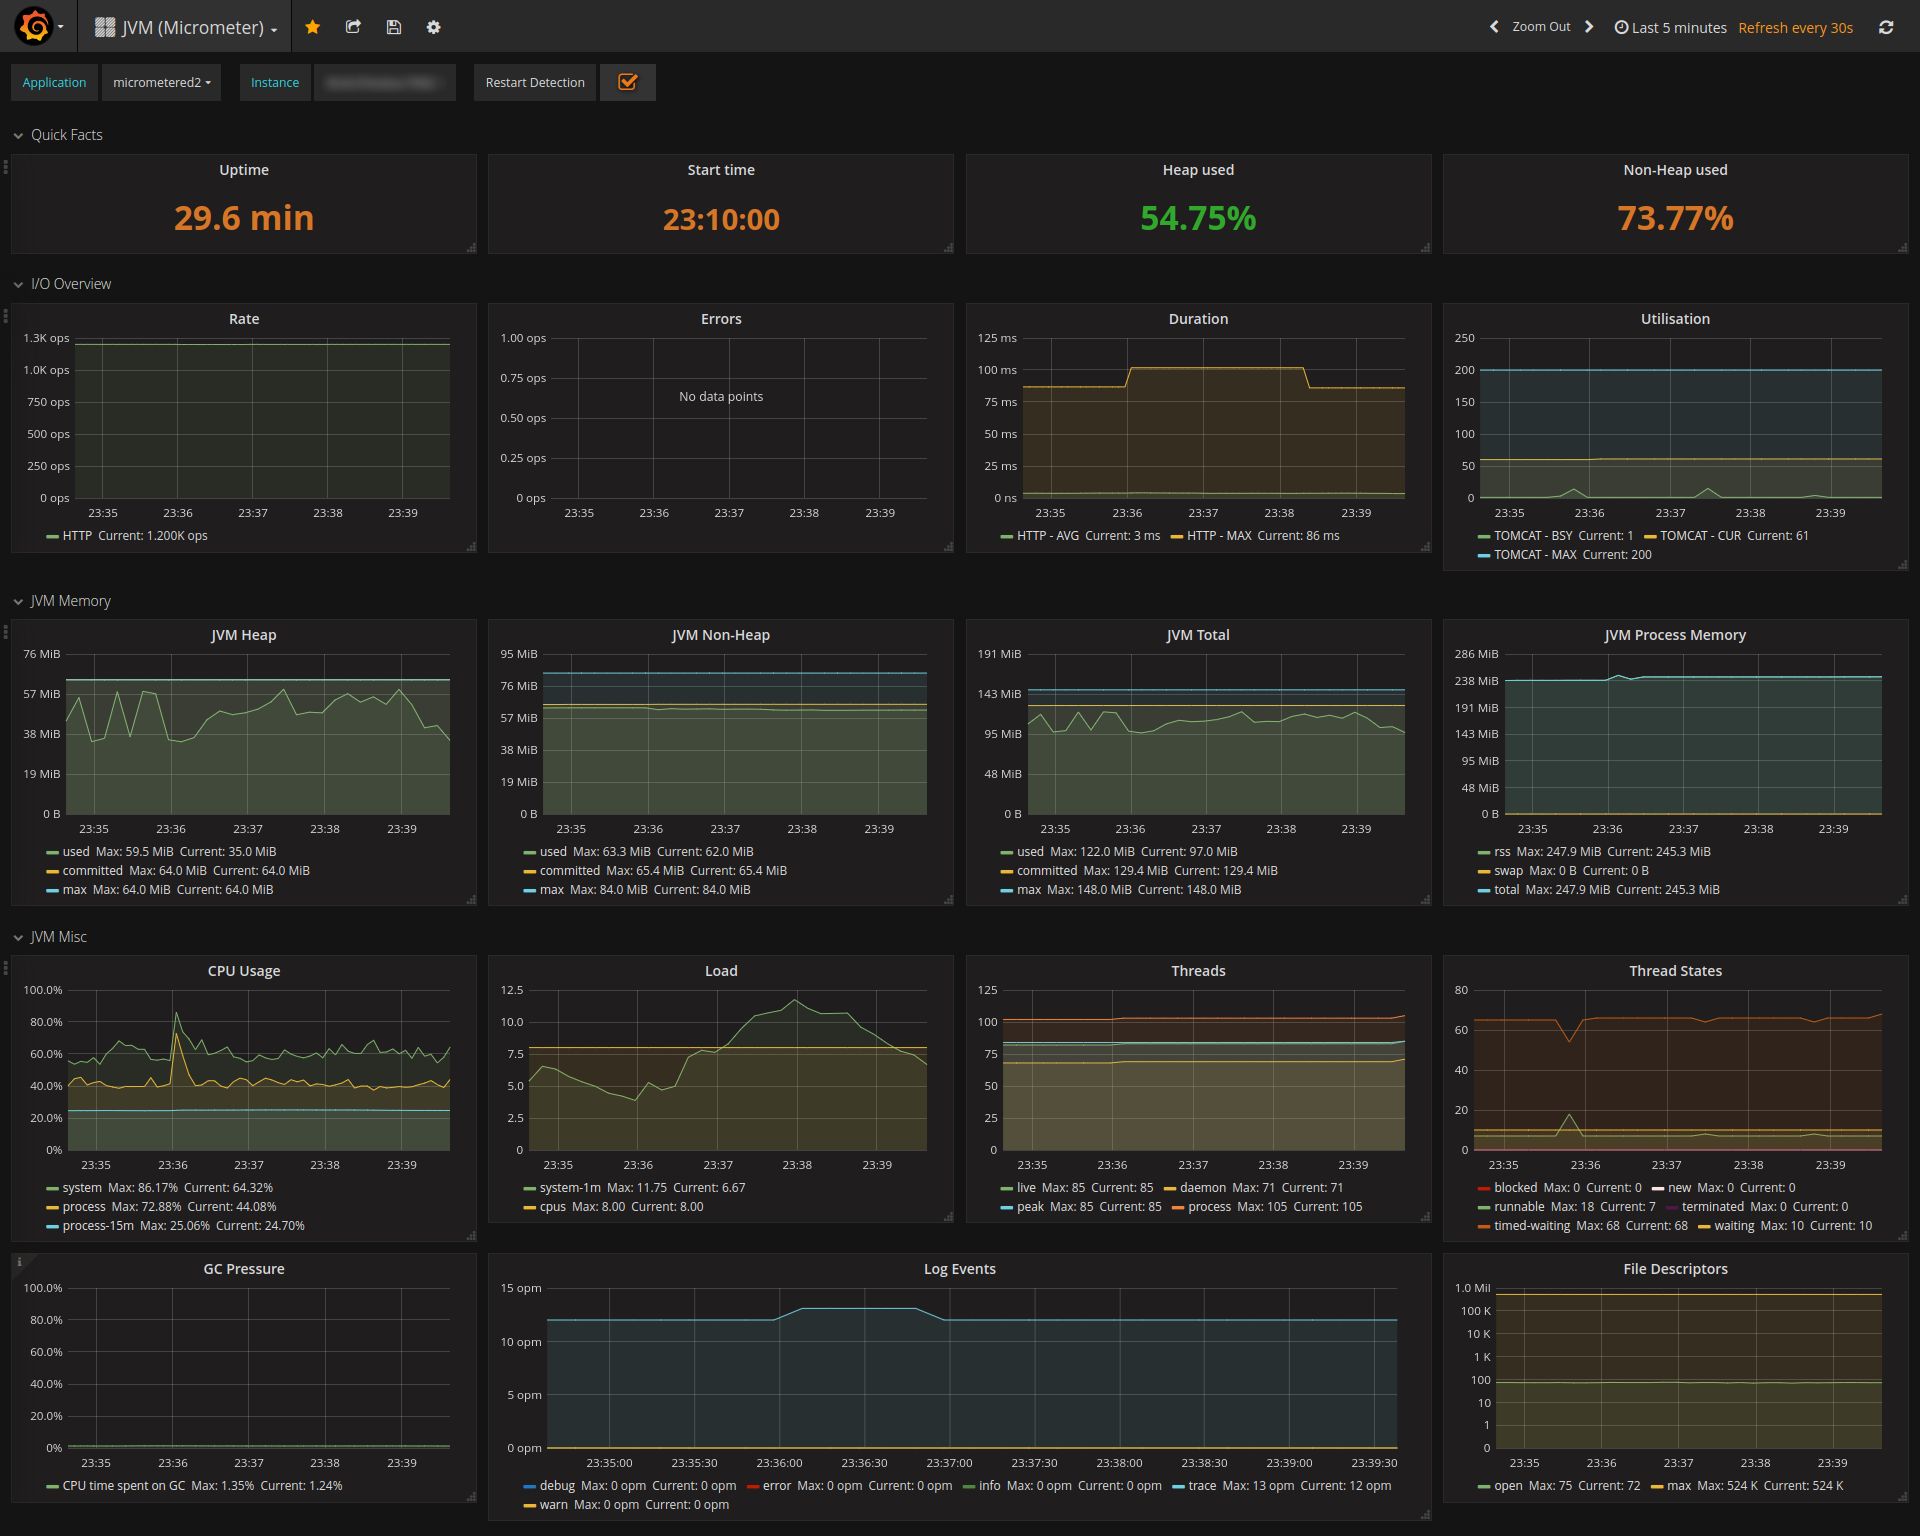
- JVM memory
- Process memory (provided by micrometer-jvm-extras)
- CPU-Usage, Load, Threads, Thread States, File Descriptors, Log Events
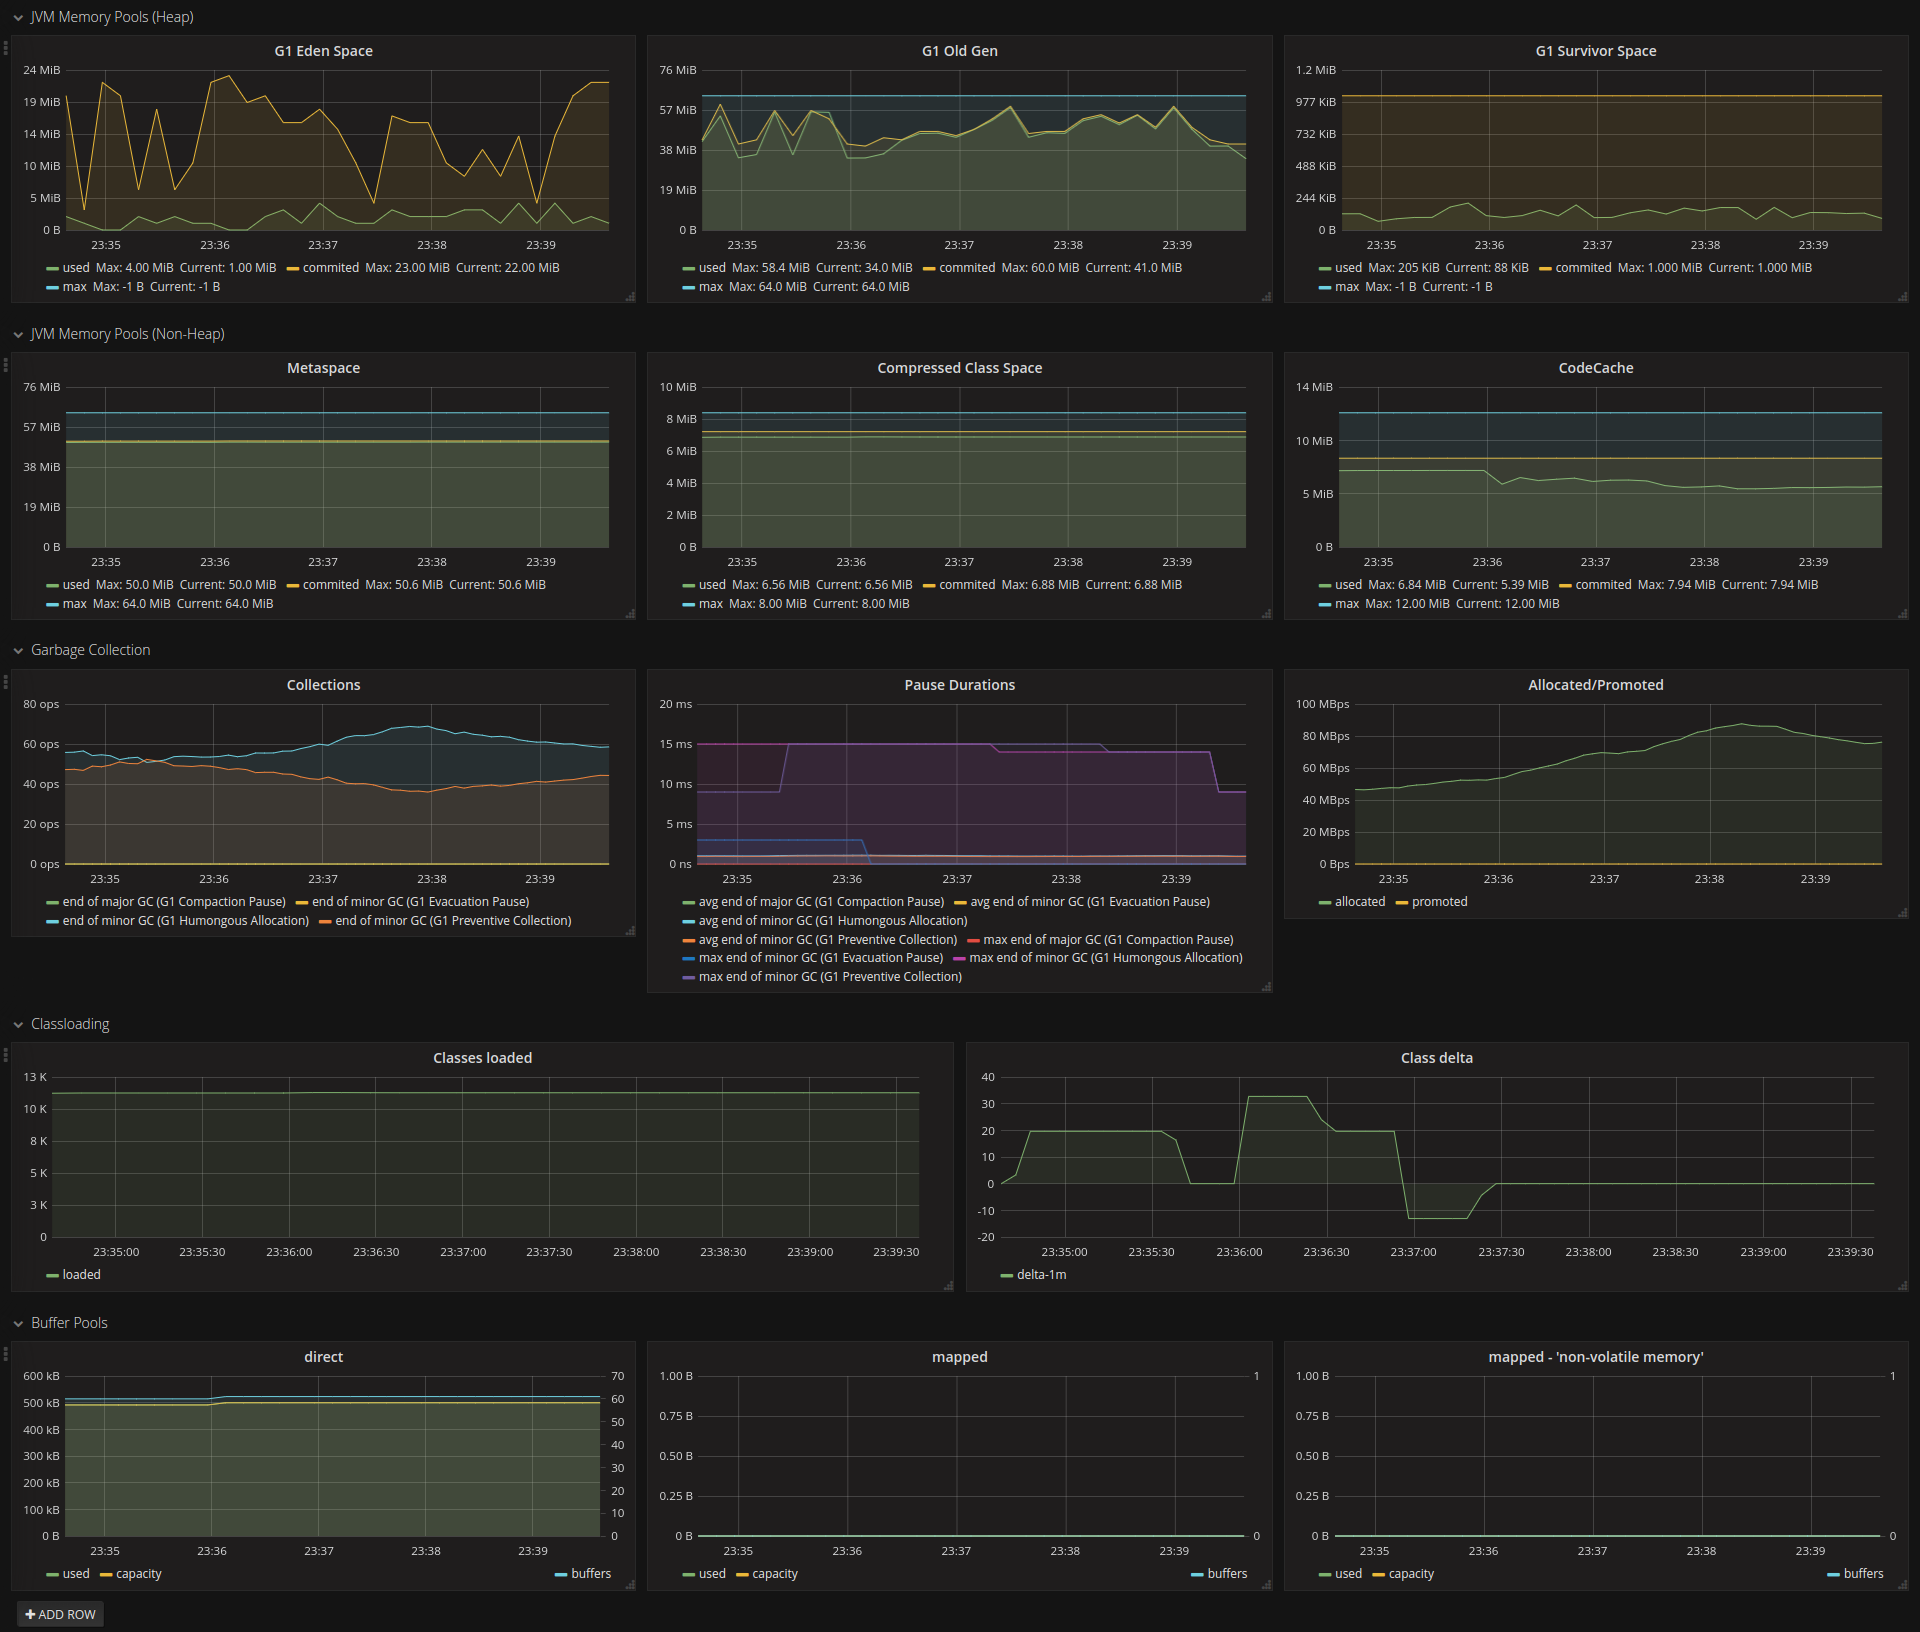
- JVM Memory Pools (Heap, Non-Heap)
- Garbage Collection/Pressure
- Classloading
- Direct-/Mapped-Buffer
- minimalist I/O Overview
- HTTP - Rate, Errors, Duration
- TOMCAT/JETTY - Utilisation
Note
Instead of using the job tag to distinct different applications, this dashboard makes use of a common tag called application applied to every metric.
In a Spring Boot setting, this could look like this:
@Bean
MeterRegistryCustomizer<MeterRegistry> configurer(
    @Value("${spring.application.name}") String applicationName) {
    return (registry) -> registry.config().commonTags("application", applicationName);
}
Or since Spring Boot 2.1 / Micrometer 1.1.0 with a property:
management.metrics.tags.application=${spring.application.name}
Compatibility
- micrometer:1.1.0+
- micrometer-jvm-extras:0.1.2+
Changelog
- 2023-05-04 (Revision 10)
- added GC Pressure panel in JVM Misc section
- changed process average CPU usage query from 1h to 15m
- reworked Buffer Pool panels
- combined buffer usage and buffer count into one panel
- fixed buffer detection (where hardcoded to "direct" and "mapped" before)
- removed JVM Memory Pool selection dropdown
- 2019-11-03 (Revision 9)
- adjusted "JVM Process Memory" panel to micrometer-jvm-extras:0.2.0 (removed 'pss' and 'swappss')
- dropped micrometer:1.0.x query fallbacks from PromQL
- minor polish
- 2019-04-15 (Revision 8)
- fixed PromQL query for Java11 non-heap areas
- GC allocation/promotion unit changed to bytes/s (from byte)
- moved process memory metrics to dedicated panel
- 2018-11-14 (Revision 7)
- updated some metric queries (with fallbacks) due to meter name changes from Micrometer
1.0.xto1.1.x - added Thread States panel
- updated some metric queries (with fallbacks) due to meter name changes from Micrometer
Contact
For suggestions or bug reports, please go to the GitHub Project.
Data source config
Collector type:
Collector plugins:
Collector config:
Revisions
Upload an updated version of an exported dashboard.json file from Grafana
| Revision | Description | Created | |
|---|---|---|---|
| Download |
Java Virtual Machine (JVM)
Easily monitor a Java virtual machine, which allows computers to run Java programs, with Grafana Cloud's out-of-the-box monitoring solution.
Learn more