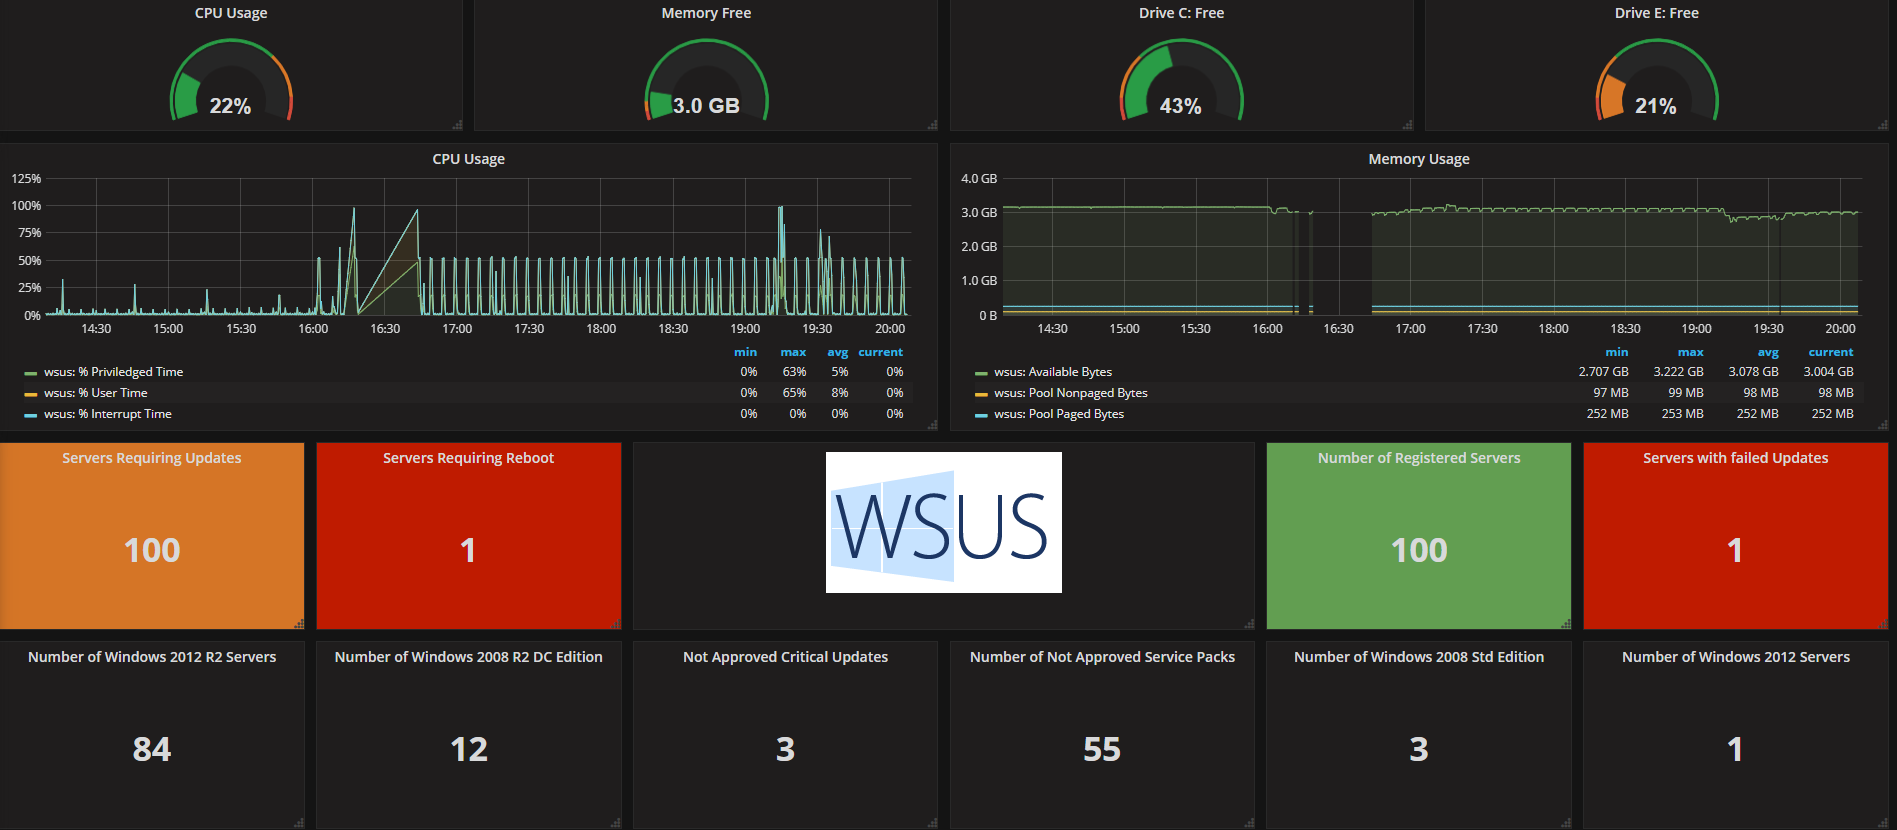
WSUS Metrics Dashboard
Windows Server Update Services - Importing this to Grafana Thank you for taking the time and looking at this script. This script lies within your Windows Server Update Management box, and the script is executed by telegraf service to input the data into grafana, via influxdb.
This dashboard was created to show the servers which are requiring patched, along with reboots, updates, failed updates. It also shows not approved patches, along with a breakdown of the servers which are registered.
Further information and installation of the dashboard and script can be found within github. https://github.com/r4yfx/wsus-grafana
Data source config
Collector config:
Upload an updated version of an exported dashboard.json file from Grafana
| Revision | Description | Created | |
|---|---|---|---|
| Download |

