
mdadm
Prometheus node_exporter mdadm module dashboard. Per Server and per md view
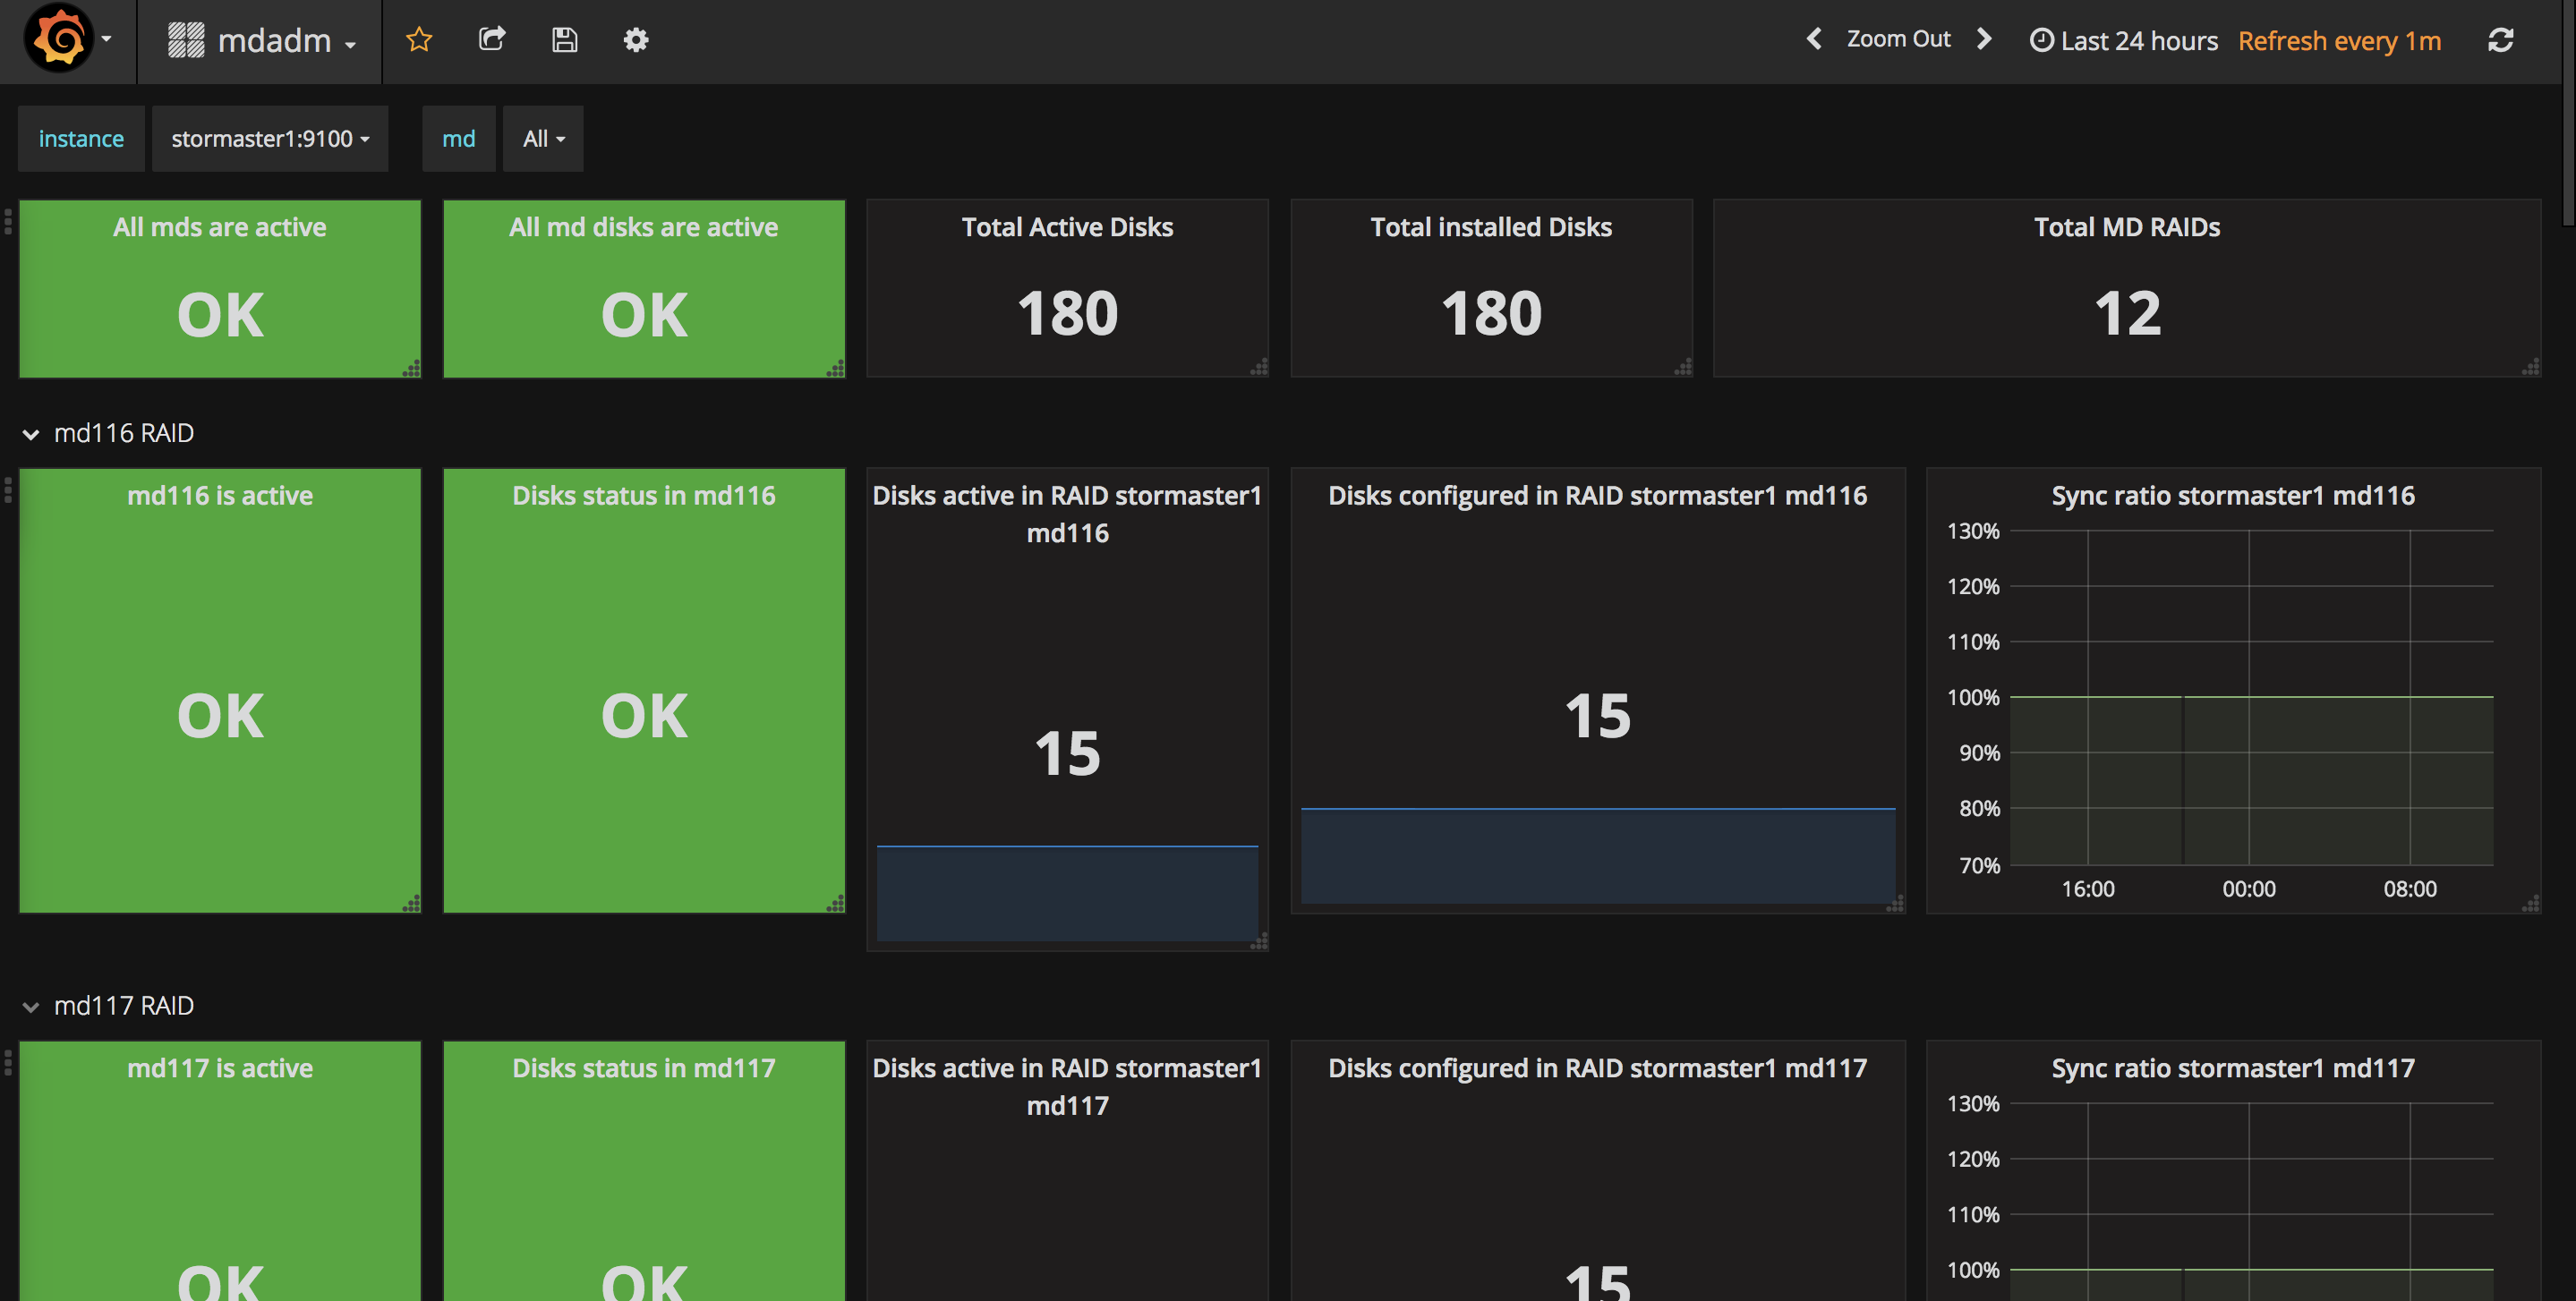
This dashboard is for the prometheus/node_exporter mdadm module. It shows:
- Active Disks Stat
- Installed Disks Stat
- Block Sync Ratio Stat
- Sync Ratio (Total, Synced Blocks) Graphs
Data source config
Collector type:
Collector plugins:
Collector config:
Revisions
Upload an updated version of an exported dashboard.json file from Grafana
| Revision | Description | Created | |
|---|---|---|---|
| Download |