
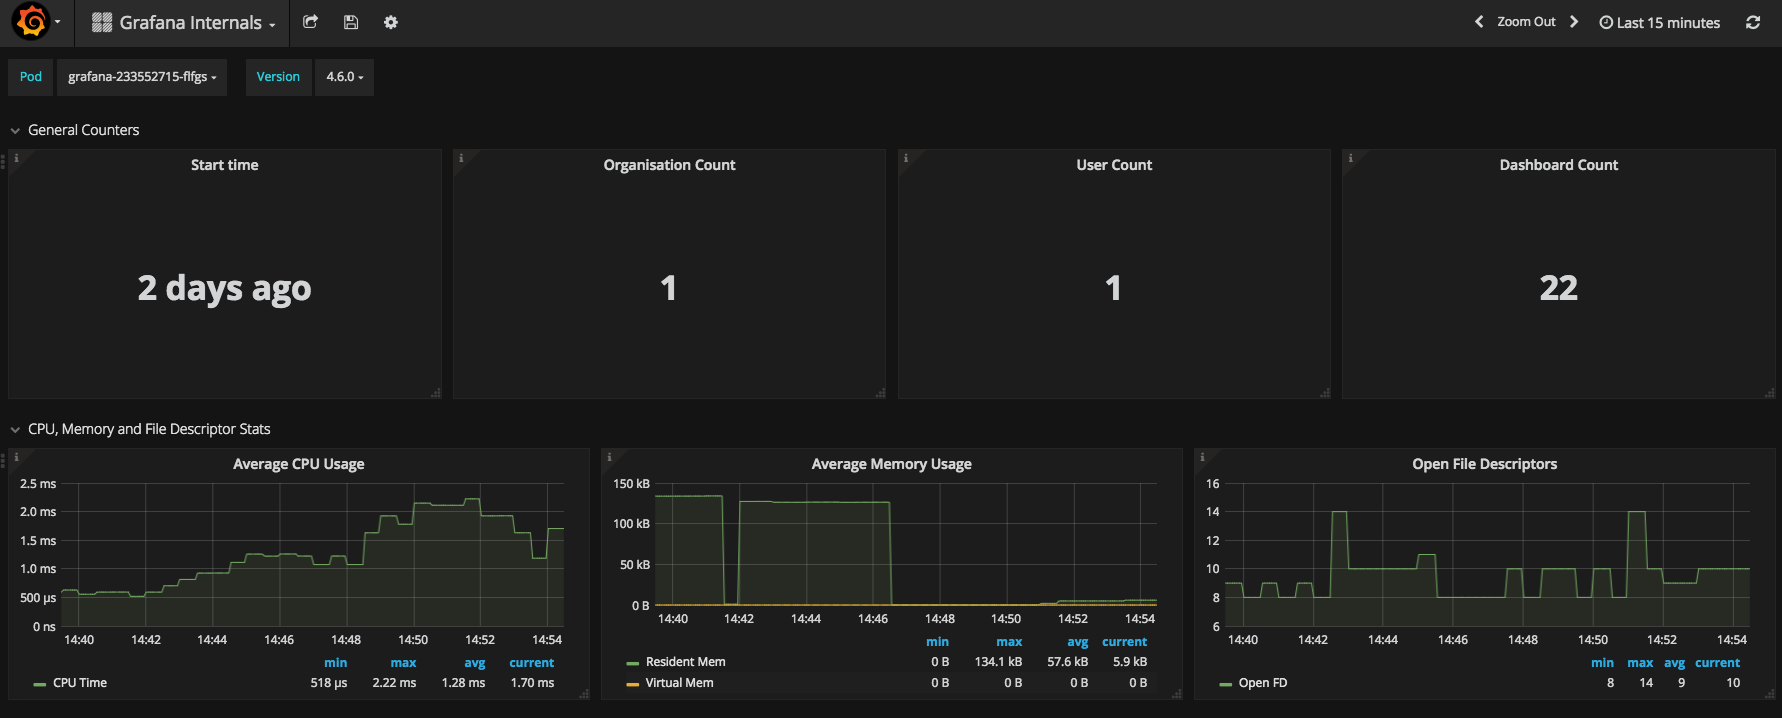
Grafana Internals
Grafana Internal Metics Dashboards
Grafana dashboard to monitor Grafana's internal metrics in a Kubernetes Environment.
The following metrics are displayed:
- Start time, org count, user count, dashboard count
- Avg CPU/Mem Usage and Open File Descriptors
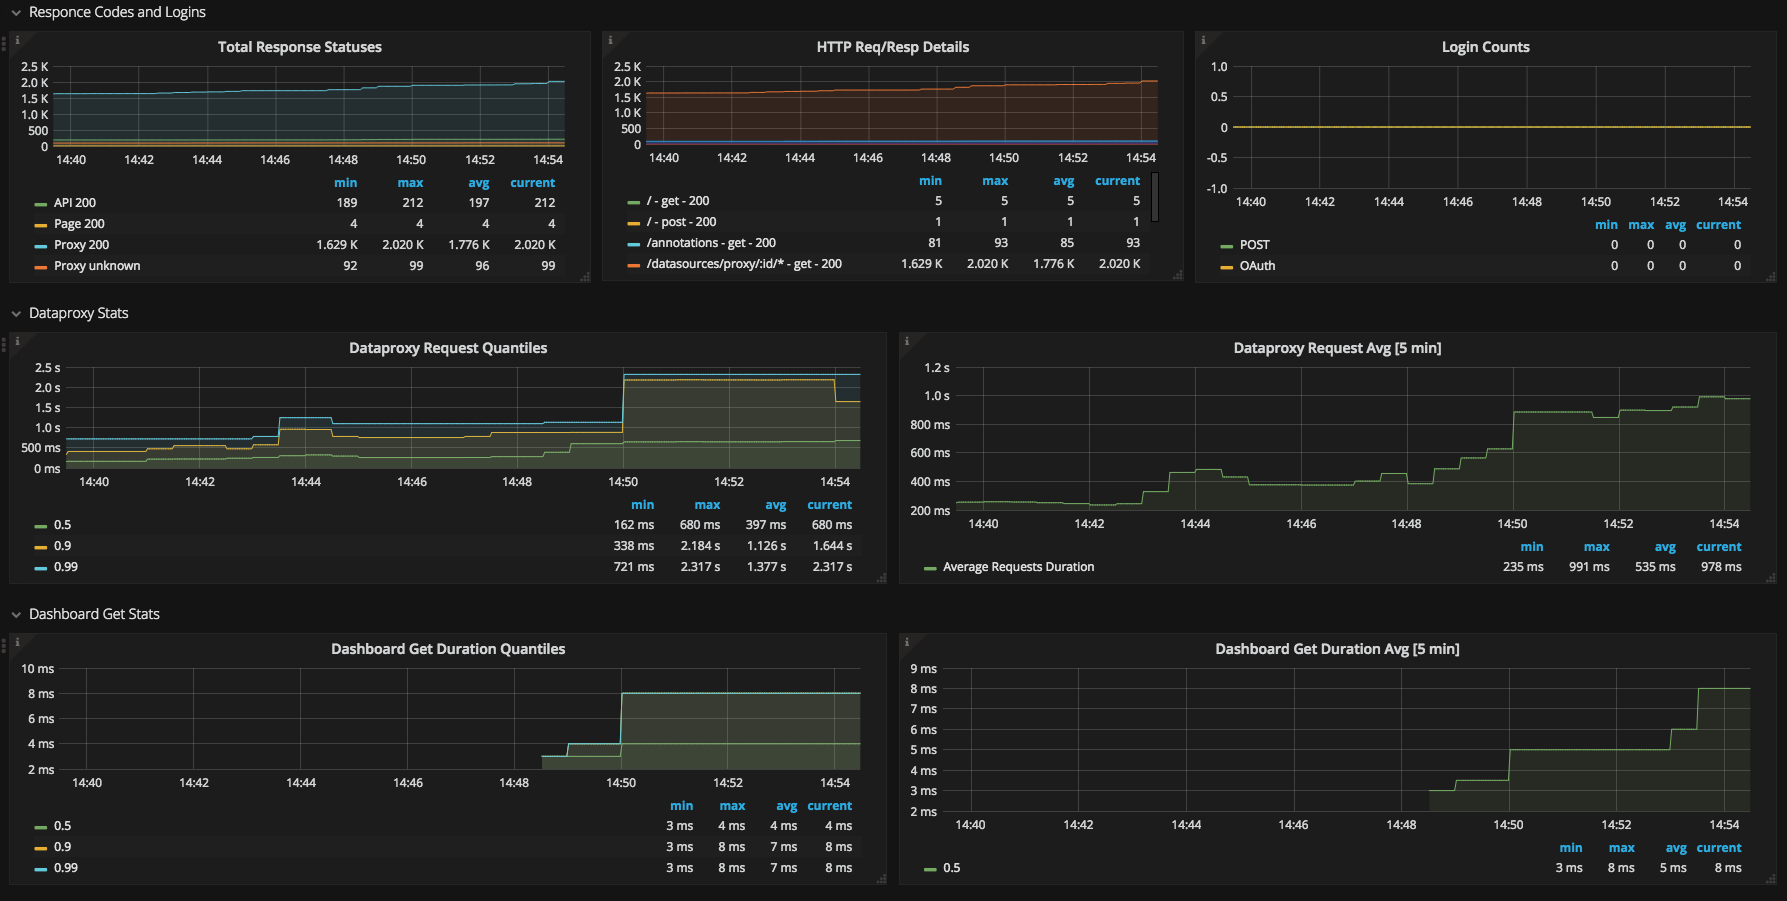
- HTTP Request/Response Codes and Login's (POST/OAuth)
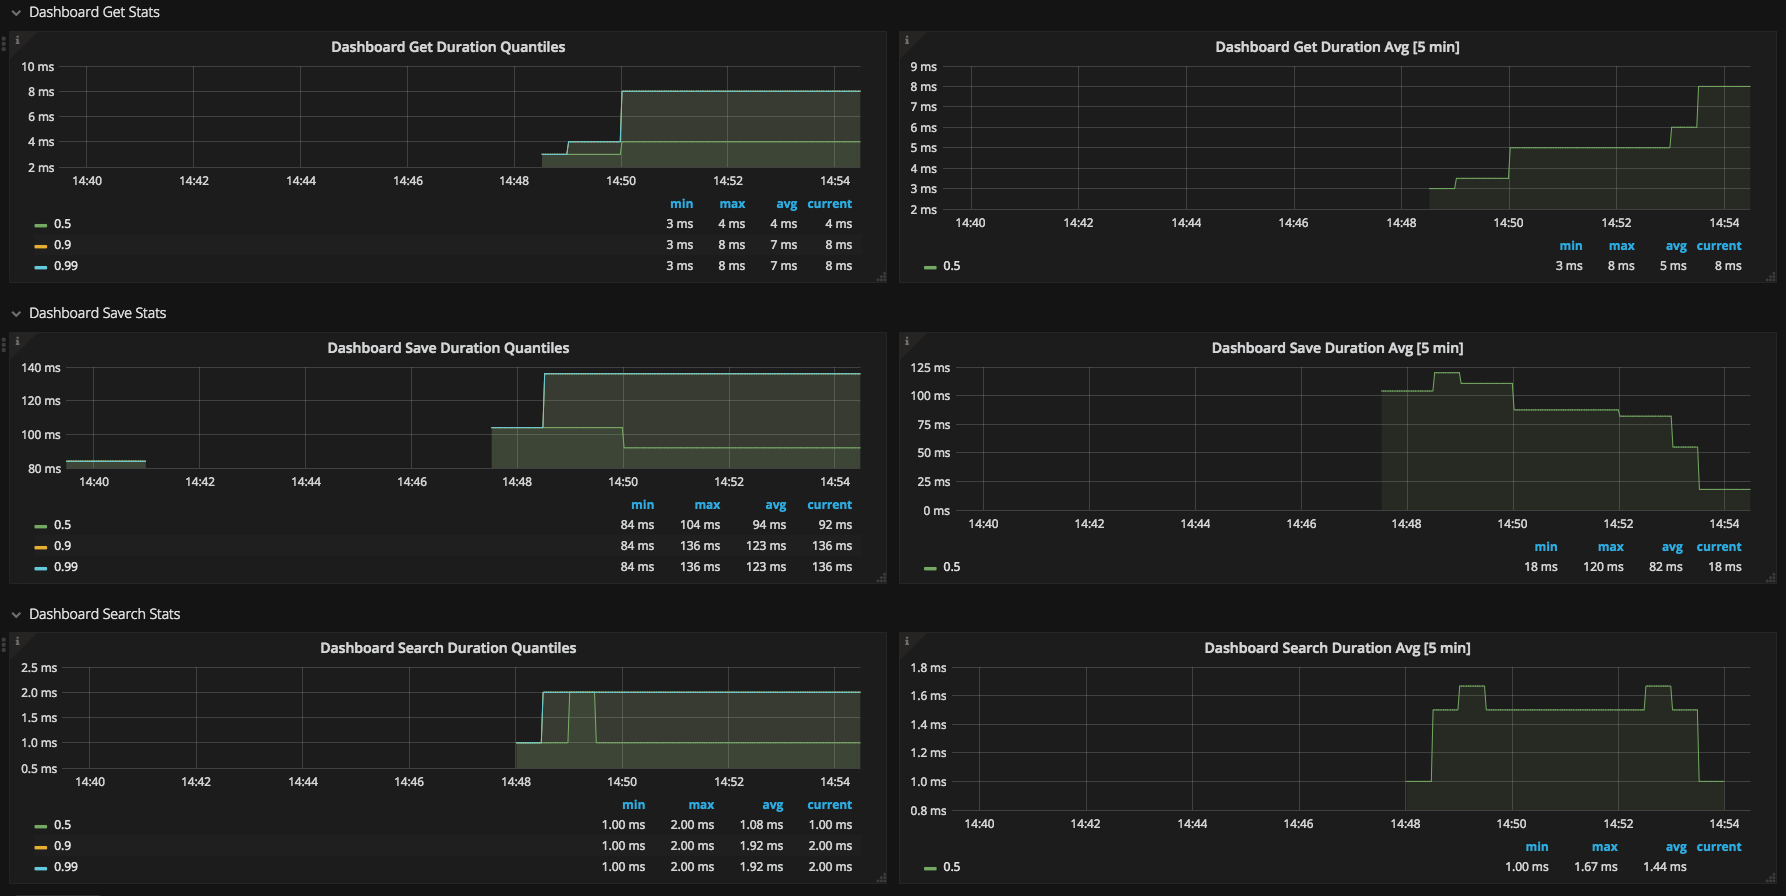
- DataProxy Requests, Dashboard Get/Save/Search Duration Statistics
Data source config
Collector type:
Collector plugins:
Collector config:
Revisions
Upload an updated version of an exported dashboard.json file from Grafana
| Revision | Description | Created | |
|---|---|---|---|
| Download |