swagger-stats dashboard v3
Swagger-Stats Main Dashboard Revision 3
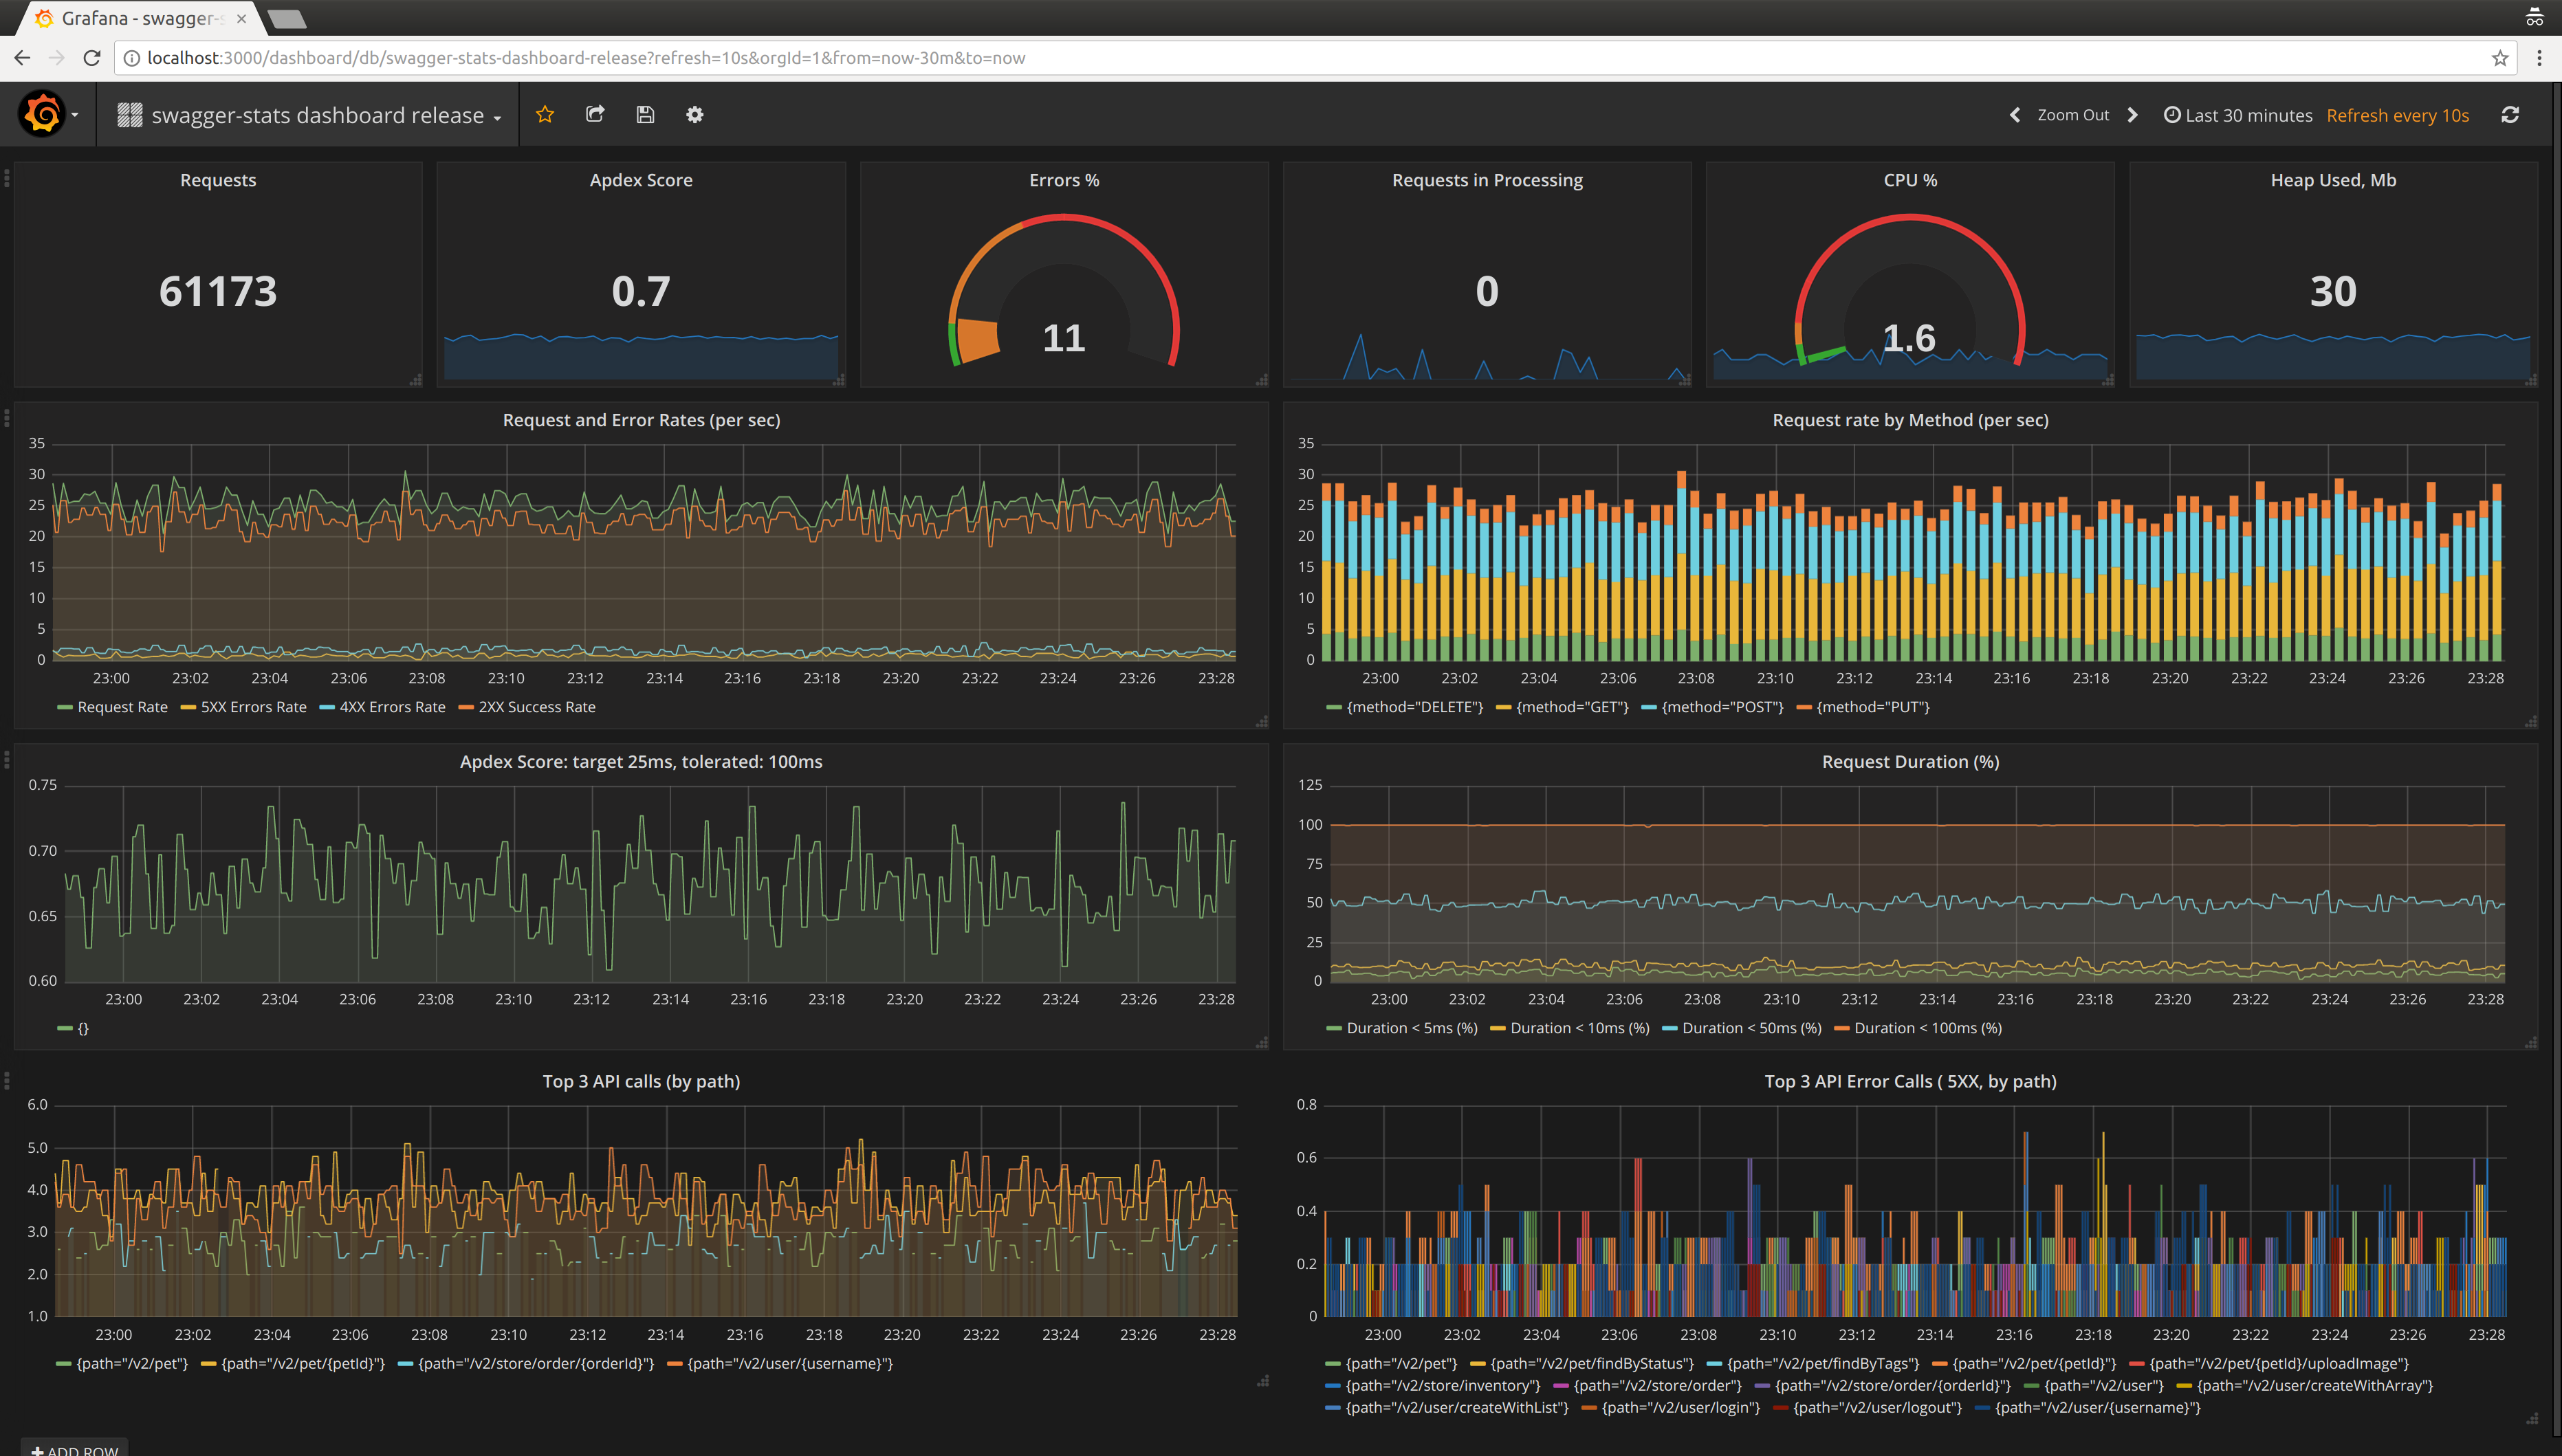
swagger-stats Main Dashboard
http://swaggerstats.io | Documentation
![]()
https://github.com/slanatech/swagger-stats
swagger-stats traces REST API requests and responses in Node.js Microservices, and collects metrics per API Operation. swagger-stats detects API operations based on express routes. You may also provide Swagger (Open API) specification, and swagger-stats will match API requests with API Operations defined in swagger specification.
swagger-stats exposes Prometheus metrics per API Operation, using labels like method="GET" and path="/pet/{petId}",
so you may use Prometheus and Grafana for API monitoring and alerting
This Dashboard is a summary top-level view on API Operation metrics provided by swagger-stats.
Prometheus Queries using swagger-stats metrics
Get Request Rate, Error Rate, Success Rate
sum (irate(api_request_total[1m]))
sum (irate(api_request_total{code=~"^5..$"}[1m]))
sum (irate(api_request_total{code=~"^4..$"}[1m]))
sum (irate(api_request_total{code=~"^2..$"}[1m]))
Get % of errors
( api_all_errors_total / api_all_request_total ) * 100
Get Apdex Score
How Apdex Score is calculated: Apdex Score
(
  sum(rate(api_request_duration_milliseconds_bucket{le="25",code=~"^2..$"}[1m]))
+
  sum(rate(api_request_duration_milliseconds_bucket{le="100",code=~"^2..$"}[1m]))
) / 2 / sum(irate(api_request_duration_milliseconds_count[1m]))
Get Request Rate by Method
sum by(method) (irate(api_request_total[1m]))
Get % of request answered within threshold, over time
Use
le="XX"to set threshold, i.e.le="25"for % of request answered under 25 msec. Values ofleshould be from the list of bucket values specified in swagger-stats optiondurationBuckets
( sum(irate(api_request_duration_milliseconds_bucket{le="25"}[1m])) / sum(irate(api_request_duration_milliseconds_count[1m])) ) * 100
Get Top 3 API Calls by Path, over time
topk(3, sum(irate(api_request_total[1m])) by (path))
Get Top 3 5XX Errors By Path, over time
topk(3, sum(irate(api_request_total{code=~"^5..$"}[1m])) by (path))
Get Node.js process CPU Usage %
nodejs_process_cpu_usage_percentage
Get Node.js process Used Heap in MB
(nodejs_process_memory_heap_used_bytes)/1048576
Data source config
Collector config:
Upload an updated version of an exported dashboard.json file from Grafana
| Revision | Description | Created | |
|---|---|---|---|
| Download |