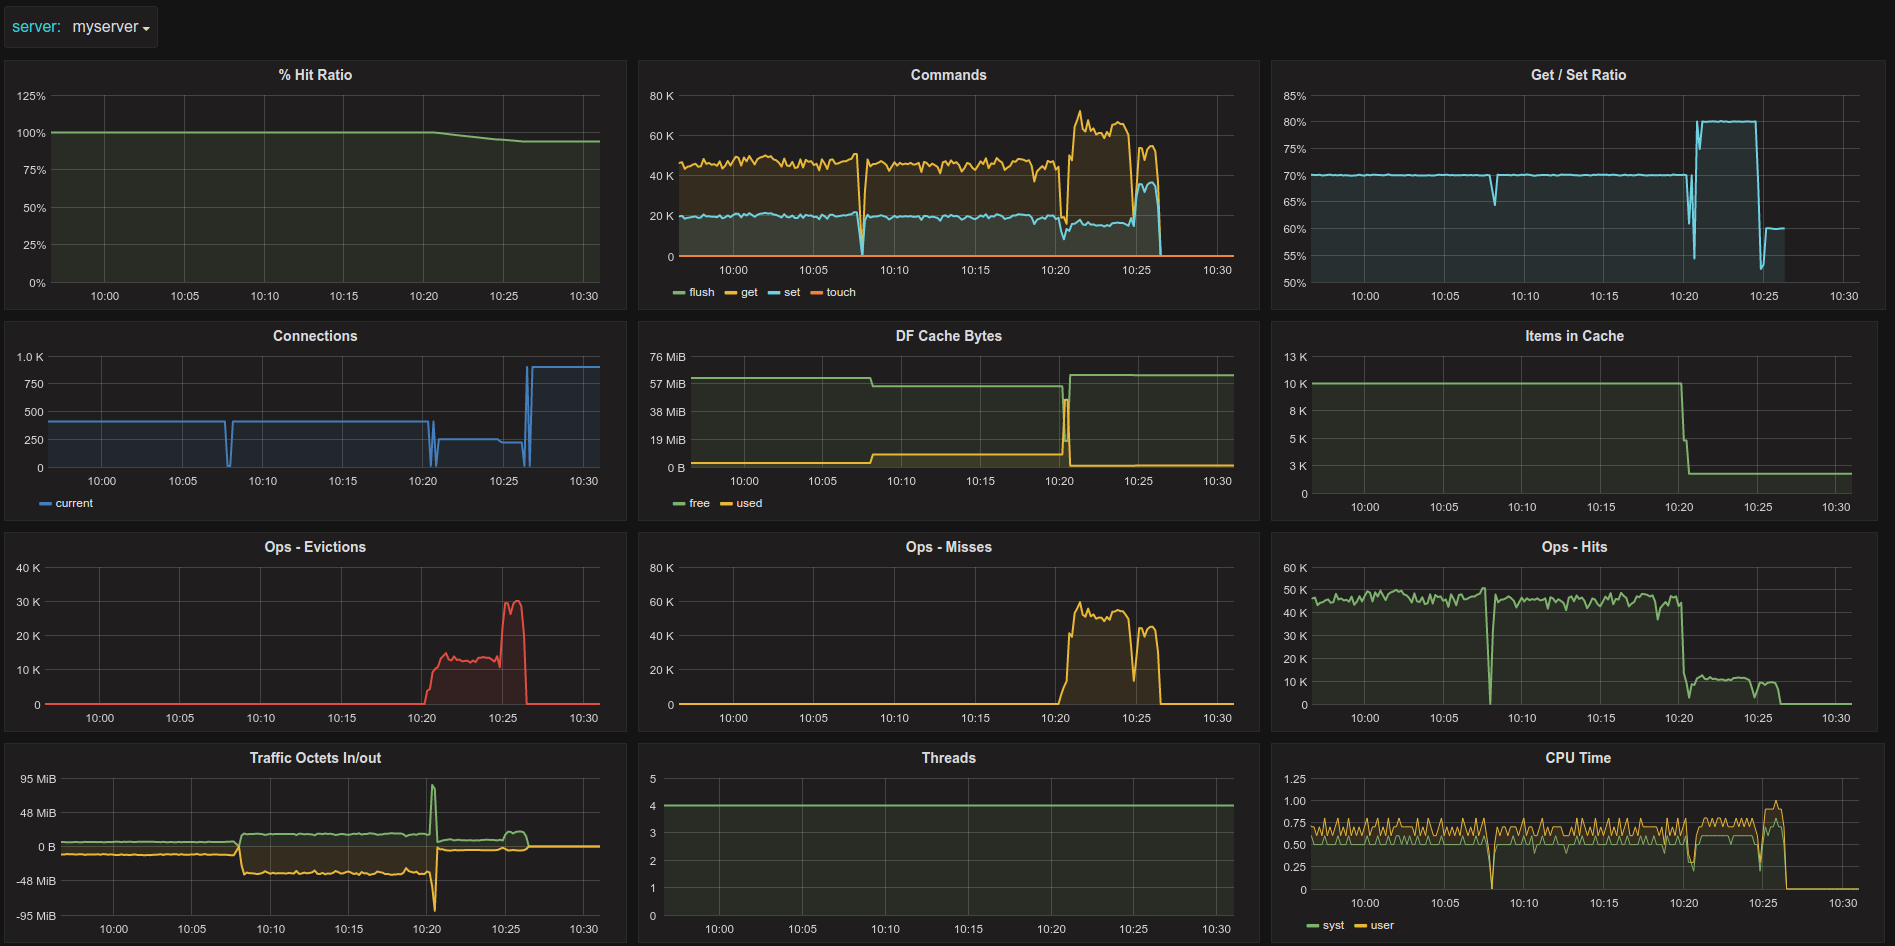
Memcached Server Metrics
Memcached Server Metrics, requires CollectD memcached plugin and Graphite
Metrics Dashboard for Memcached server.
Features
- Server template variable (so if you have multiple memcached server you can pick which one you want at the top of the dashboard)
- Hit Ratio, Commands, Get / Set Ratio
- Connections, DF Cache Bytes (free/used), Items In Cache
- Ops - Evictions, Ops - Misses, Ops - Hits,.
- Traffic Octets In/out, Process Threads, CPU Time
CollectD config can be found here: collectd.conf
The relevant parts for this dashboard is
LoadPlugin memcached
<Plugin "memcached">
Host "127.0.0.1"
Port "11211"
</Plugin>
Metric Prefix
When you import the dasbhoard you will have to specify your collectd metric prefix, this is by defauilt just collectd. The dashboard assumes the following metric structure $prefix.$server.memcached.... So if you have a non standard collectd prefix like prod.cacheservers then specify that in the prefix field when you import the dashboard. During import when you specify the prefix do not include the last dot (.).
Make this dashboard better
For feedback and ideas to improve this dashboard please open an issue here: https://github.com/torkelo/dashboards
Data source config
Collector config:
Upload an updated version of an exported dashboard.json file from Grafana
| Revision | Description | Created | |
|---|---|---|---|
| Download |
Memcached
Easily monitor Memcached, the distributed, in-memory key-value store, with Grafana Cloud's out-of-the-box monitoring solution.
Learn more
