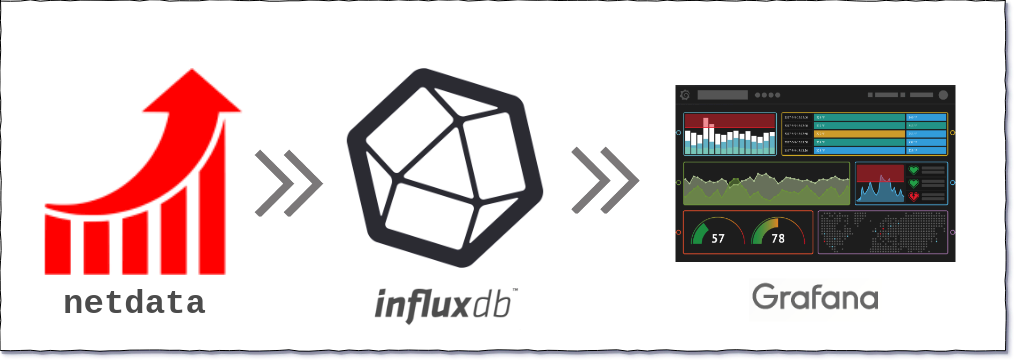
Templated Netdata Dashboard
Templated Linux system-monitor dashboard for Netdata-collected system-stats using InfluxDB datastore.
Dashboard for Netdata monitoring system via Influxdb time-series database
Homepage: https://kmonsoor.github.io/netdata-influx-grafana/

To use this dashboard:
- Download the
dashboard.jsonfrom here or copy the raw version of the JSON from Github repo. - Modify all the
datasourcefrom to your datastore's name that you've defined in your Grafana. - Update all the
measurements in the JSON e.g."netdata.system.cpu.user"to"your-prefix.system.cpu.user". - Now, create a new dashboard using the
Importbutton on Grafana's dashboard-list menu and pasting the edited JSON.
Please note that depending on your specific distro, some metrics may have slightly different names e.g. ["xvda", "xvda1"]. You should edit and match those by editing directly on the dashboard.
Initially, it was based on this dashboard on Grafana gallery. Later, it was updated mainly to include templating variable for machine names.
If it's useful for you, please feel free to share it, suggest improve and "star" it on Github
Data source config
Collector config:
Upload an updated version of an exported dashboard.json file from Grafana
| Revision | Description | Created | |
|---|---|---|---|
| Download |
