ClickHouse Queries
Helps to visualize most frequent, slowest, failed queries. Shows queries rate per second, table with last queries
Dashboard based on information from ClickHouse system table system.query_log.
Template variables:
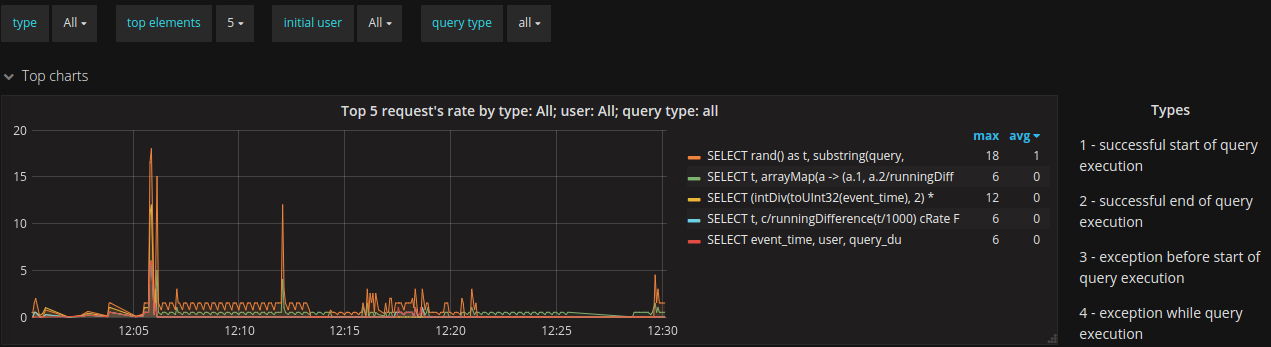
- type - type of the query, documented in dashboard
- top elements - number of elements to display; for example: top 5 or top 10
- initial user - user who initiated query execution
- query type - select or insert
Charts:
- Graph Top queries rate - graph shows top executed queries per second
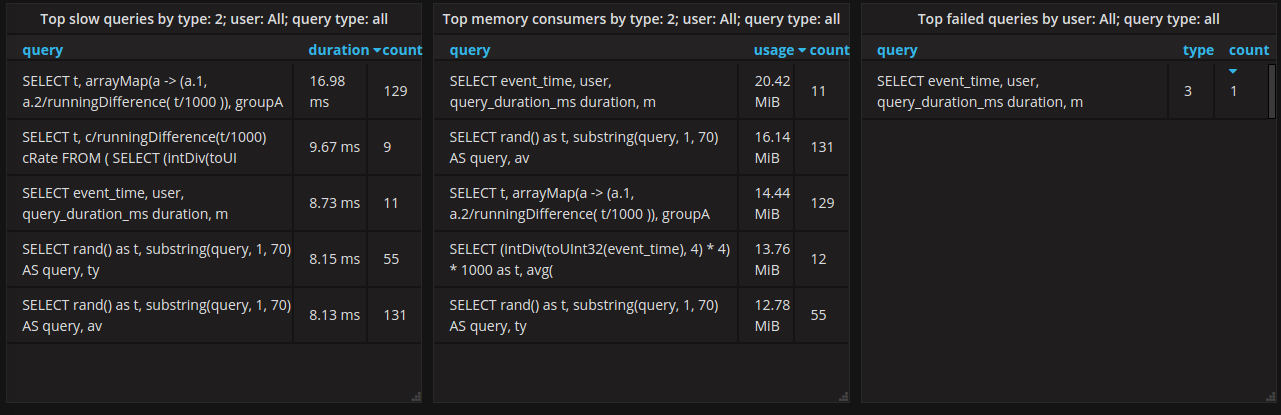
- Top slow queries - table shows slowest queries
- Top memory consumers queries - table shows most memory expensive queries
- Top failed queries - table shows failed queries ordered by count
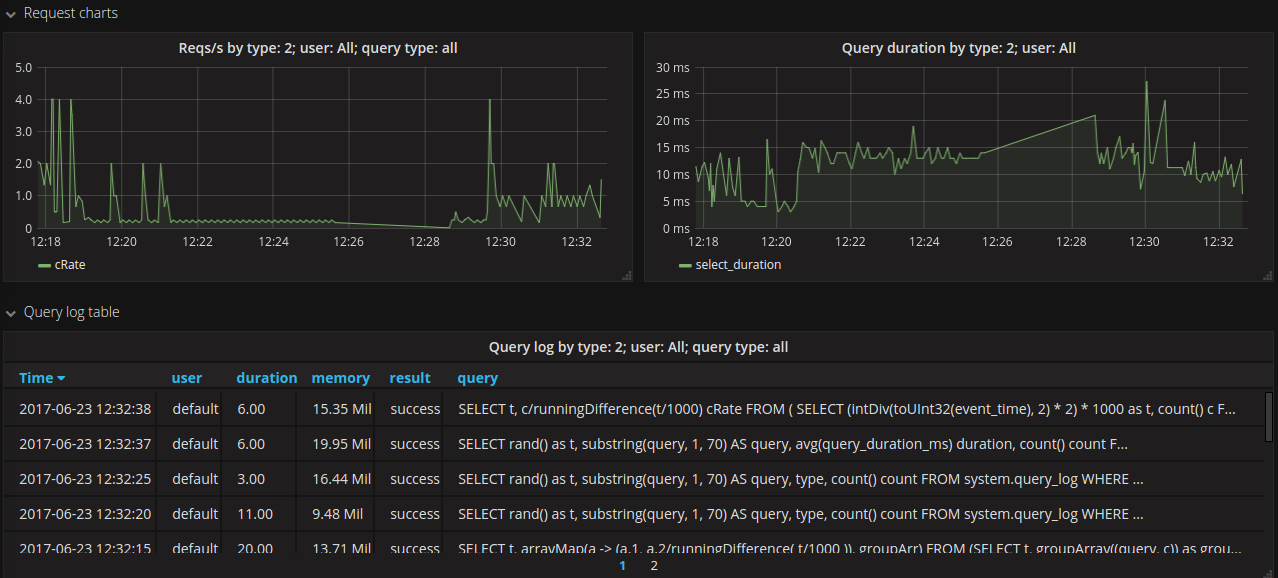
- Request charts - two graphs shows queries-per-second rate and query duration
- Query log table - shows last executed queries
How to install
To enable ClickHouse query logging you will need to add <log_queries>1</log_queries> param into section to your user configuration section. For example:
  <!-- Profiles of settings. -->
    <profiles>
        <!-- Default settings. -->
        <default>
             <log_queries>1</log_queries>
After this, ClickHouse should create table system.query_log.
Important: CH do not log values for insert queries
To query data from ClickHouse use https://grafana.com/plugins/vertamedia-clickhouse-datasource
If you need to show queries from ClickHouse cluster - create distributed table. For example:
CREATE TABLE system.query_log_all AS system.query_log ENGINE = Distributed(<your_cluster_name>, system, query_log);
Data source config
Collector config:
Upload an updated version of an exported dashboard.json file from Grafana
| Revision | Description | Created | |
|---|---|---|---|
| Download |
ClickHouse
Monitor ClickHouse with Grafana. Easily keep tabs on your instance or cluster with Grafana Cloud's out-of-the-box monitoring solution.
Learn more