CollectD Server Metrics
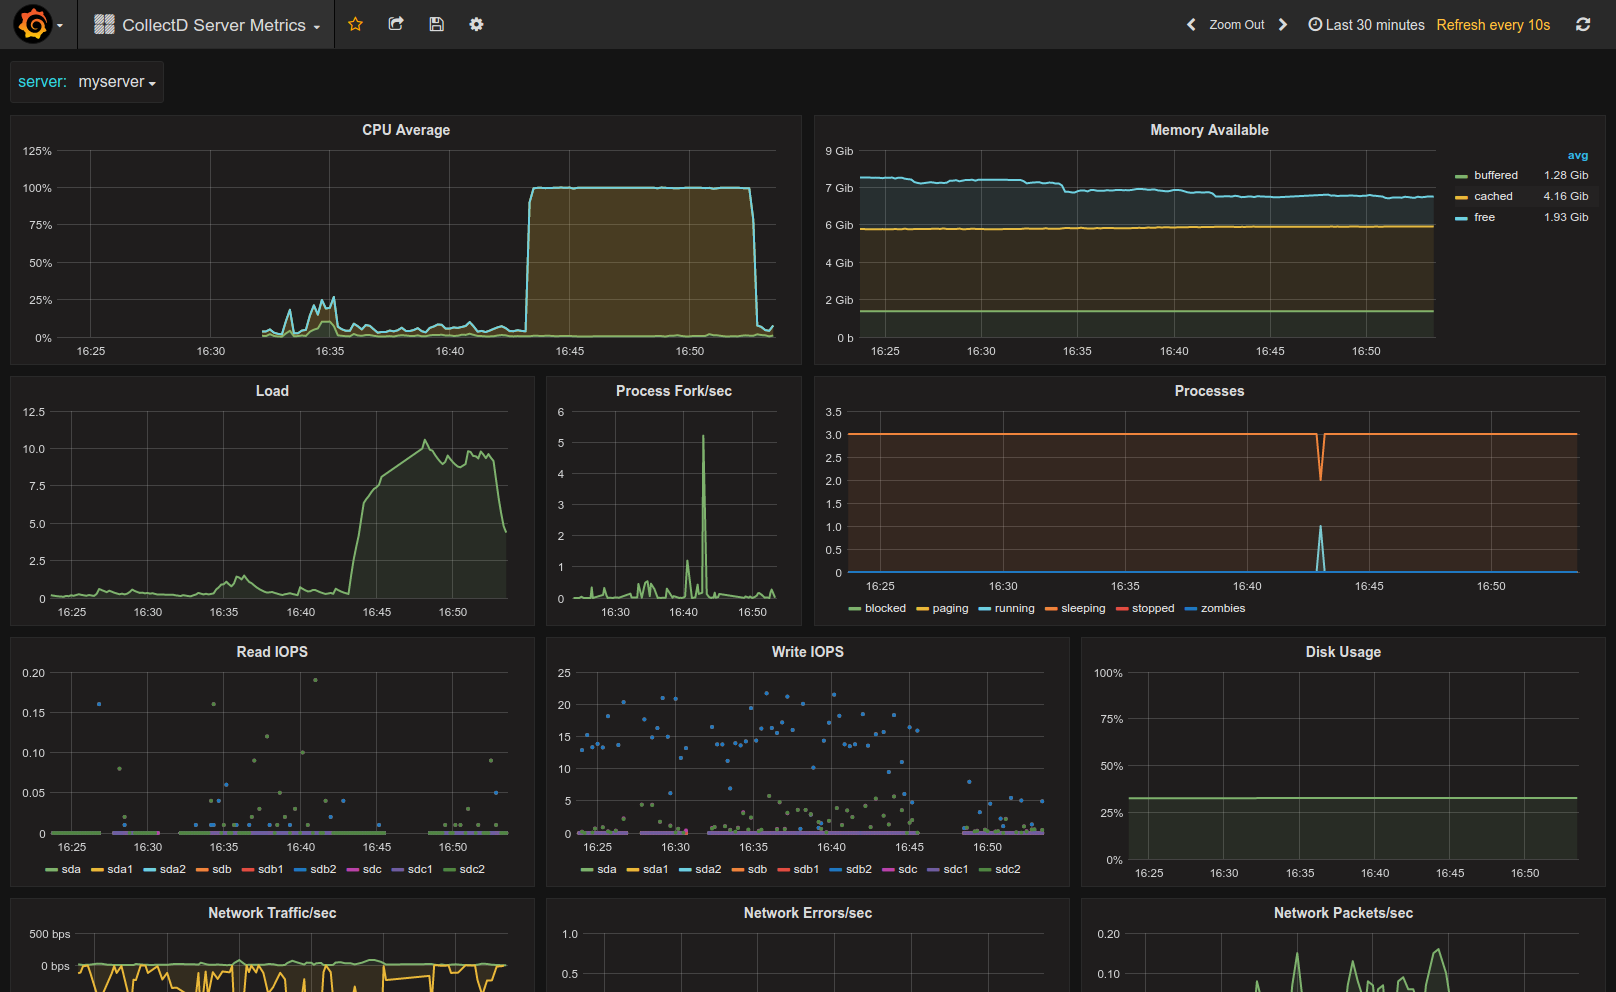
CollectD & Graphite Server Metrics Dashboard with CPU, Memory, IO & Disk Stats
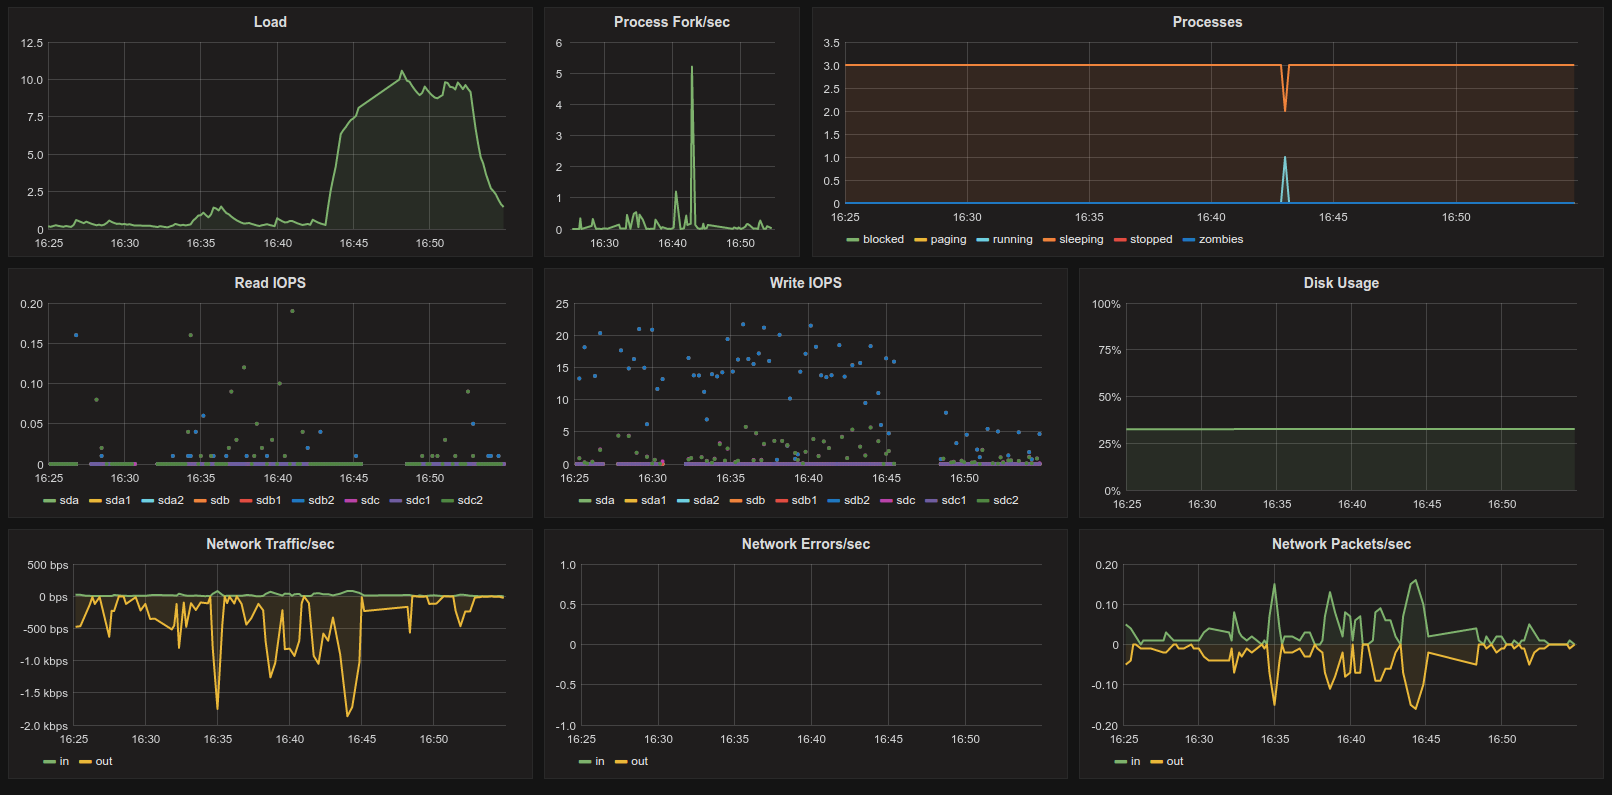
Simple Server Metrics Dashboard using Graphite and CollectD.
Dashboard metrics
- CPU Average (over all cores)
- Load
- Processes (Forks, state)
- Memory usage
- Disc usage
- Network Packets, Traffic, Errors
CollectD config can be found here: collectd.conf
That config file configures CollectD to send metrics to Graphite every 10s. Change this to match your Graphite storage schema config and your lowest retention interval.
Metric Prefix
By default the prefix is just collectd but you can change that in the collectd config file. You can also change that when you import the dashboard. During import when you specify the prefix do not include the trailing dot (.).
Make it better
For feedback and ideas to improve this dashboard please open an issue here: https://github.com/torkelo/dashboards
Data source config
Collector config:
Upload an updated version of an exported dashboard.json file from Grafana
| Revision | Description | Created | |
|---|---|---|---|
| Download |


