MySQL Dashboards for Graphite
Percona MySQL dashboards that work with graphite
Grafana dashboards for measuring MySQL performance with Graphite
These are Grafana dashboards for MySQL to be used with Graphite. They are based on great Percona dashboards for Prometheus. I try to mimic them as close as possible.
Currently, the following dashboards are available:
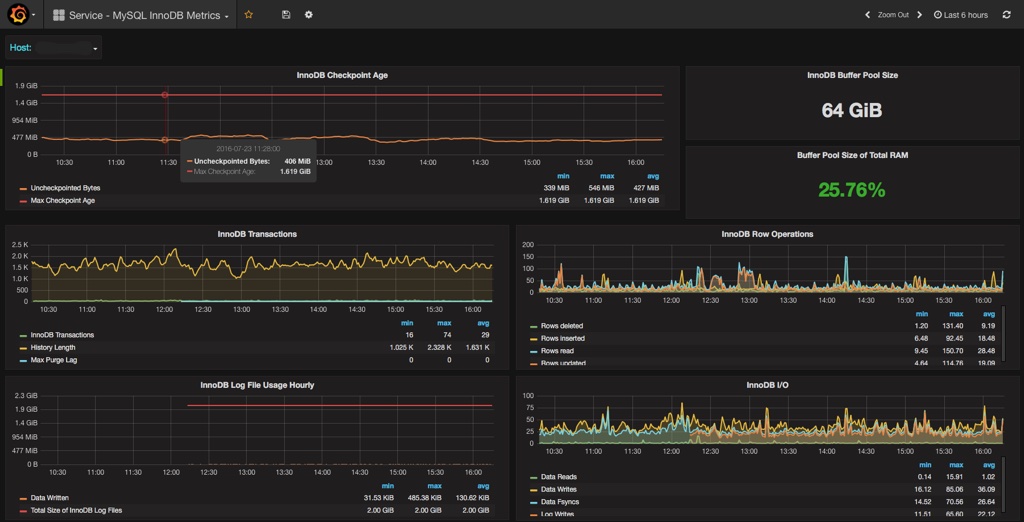
- MySQL InnoDB Metrics
- MySQL MyISAM Metrics
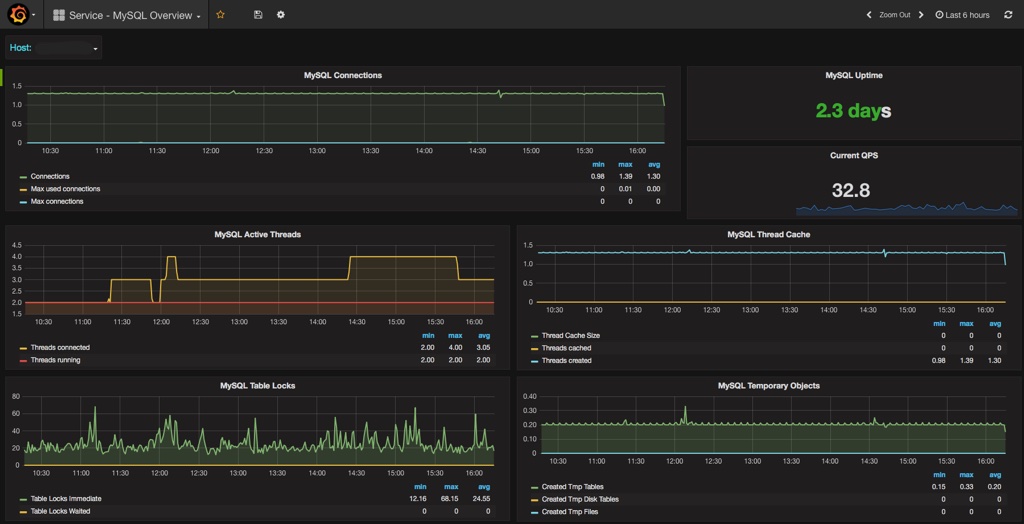
- MySQL Overview
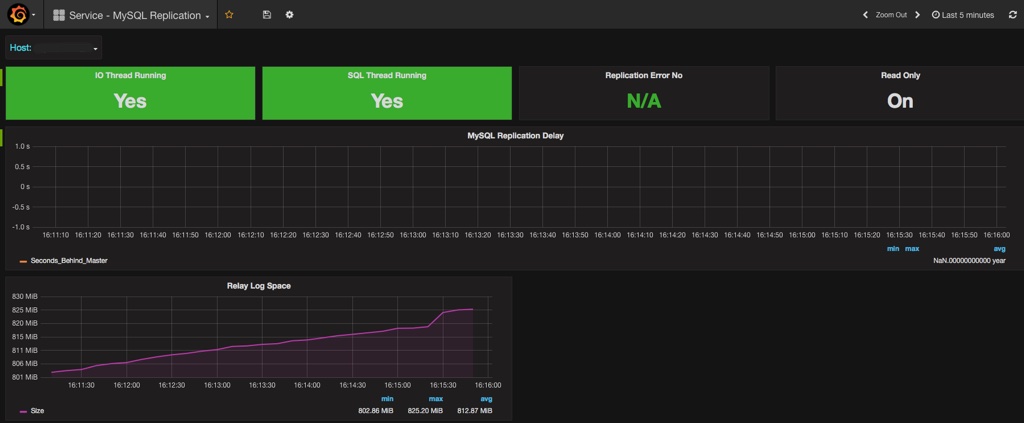
- MySQL Replication
Getting all the dashboards
Since it's not possible to upload multiple dashboards, get the rest of them on https://github.com/matejzero/grafana-dashboards
Usage and prefix
These dashboards are meant to be used with CollectD as a metrics collector. Provided mysql.py CollectD plugin must be used to gather statistics and put them in the right prefix.
Default prefix in dashboards is servers.
Collectd configuration
If you don’t already have the Python module loaded, you need to configure it first:
<LoadPlugin python>
    Globals true
</LoadPlugin>
<Plugin python>
    ModulePath "/path/to/python/modules"
</Plugin>
You should then configure the MySQL plugin:
<Plugin python>
    Import mysql
    <Module mysql>
        Host "localhost" (default: localhost)
        Port 3306 (default: 3306)
        User "root" (default: root)
        Password "xxxx" (default: empty)
        HeartbeatTable "percona.heartbeat" (if using pt-heartbeat to track slave lag)
        Verbose false (default: false)
    </Module>
</Python>
There is also a host variable which is set to sql* by default(I might remove that in the future). If your server has different name, change is accordingly.
ChangeLog
- Rev 1: Initial upload
Make it better
For all ideas and ways to make it better, please open an issue and I'll do my best to make it better: https://github.com/matejzero/grafana-dashboards
Data source config
Collector config:
Upload an updated version of an exported dashboard.json file from Grafana
| Revision | Description | Created | |
|---|---|---|---|
| Download |
MySQL
Monitor MySQL with Grafana. Easily monitor your MySQL deployment with Grafana Cloud's out-of-the-box monitoring solution.
Learn more


