VictoriaMetrics - vmanomaly - self-monitoring
Self-monitoring for VictoriaMetrics Anomaly Detection (vmanomaly) v1.18.4 or higher
VictoriaMetrics Anomaly Detection (vmanomaly) overview
Requirements
vmanomaly: Each revision may require a different version of vmanomaly. Current recommended version - 1.18.4 or higher
Grafana: Each revision may require a different version of Grafana.
This dashboard requires the Prometheus datasource.
To scrape metrics, configure VictoriaMetrics, vmagent, or Prometheus to scrape the vmanomaly-addr/metrics endpoint. Use vmanomaly as the default job name. Please note that you need to enable optional monitoring.pull config component to achieve that:
monitoring:
  pull: # enable /metrics endpoint.
  addr: "0.0.0.0"
  port: 8080
Alternatively, metrics can be pushed directly from vmanomaly - refer to these docs for more information.
Note: You can override the
joblabel for the push model using theextra_labelsargument in themonitoring.pushconfig component, as shown below:
monitoring:
  push:
    url: "http://localhost:8480/"
    tenant_id: "0:0" # for cluster version only
    # other parameters ...
    extra_labels:
      job: "vmanomaly-custom-job-name"
      # other extra labels, if needed
More details on monitoring vmanomaly (including dashboards and alerting rules) can be found here.
Description
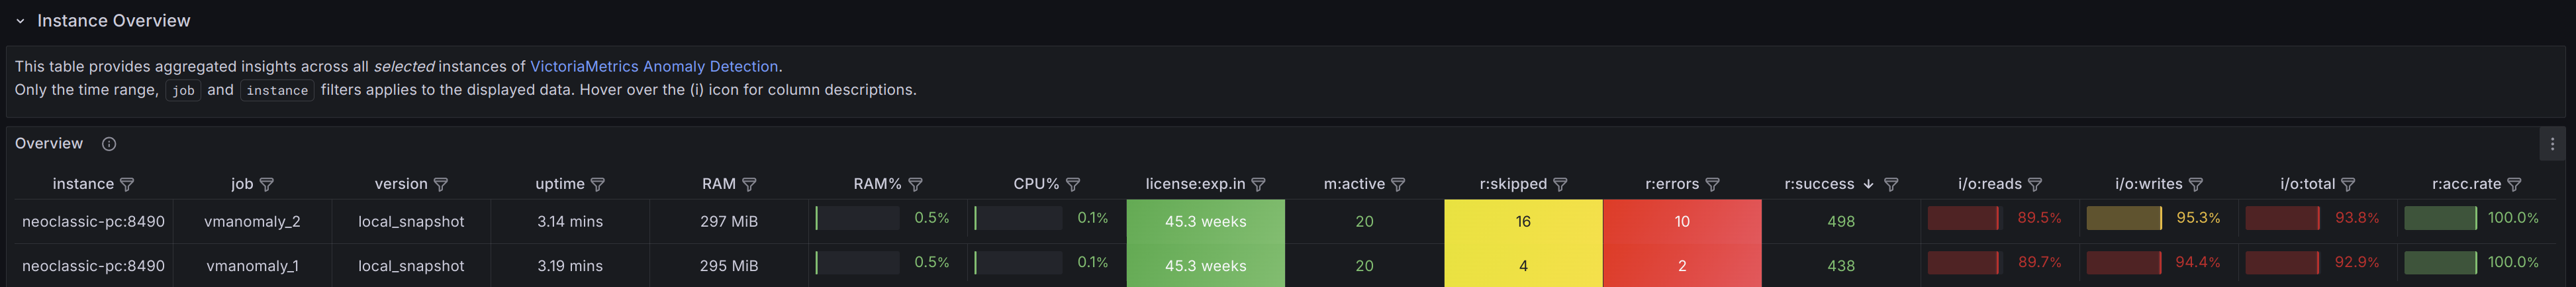
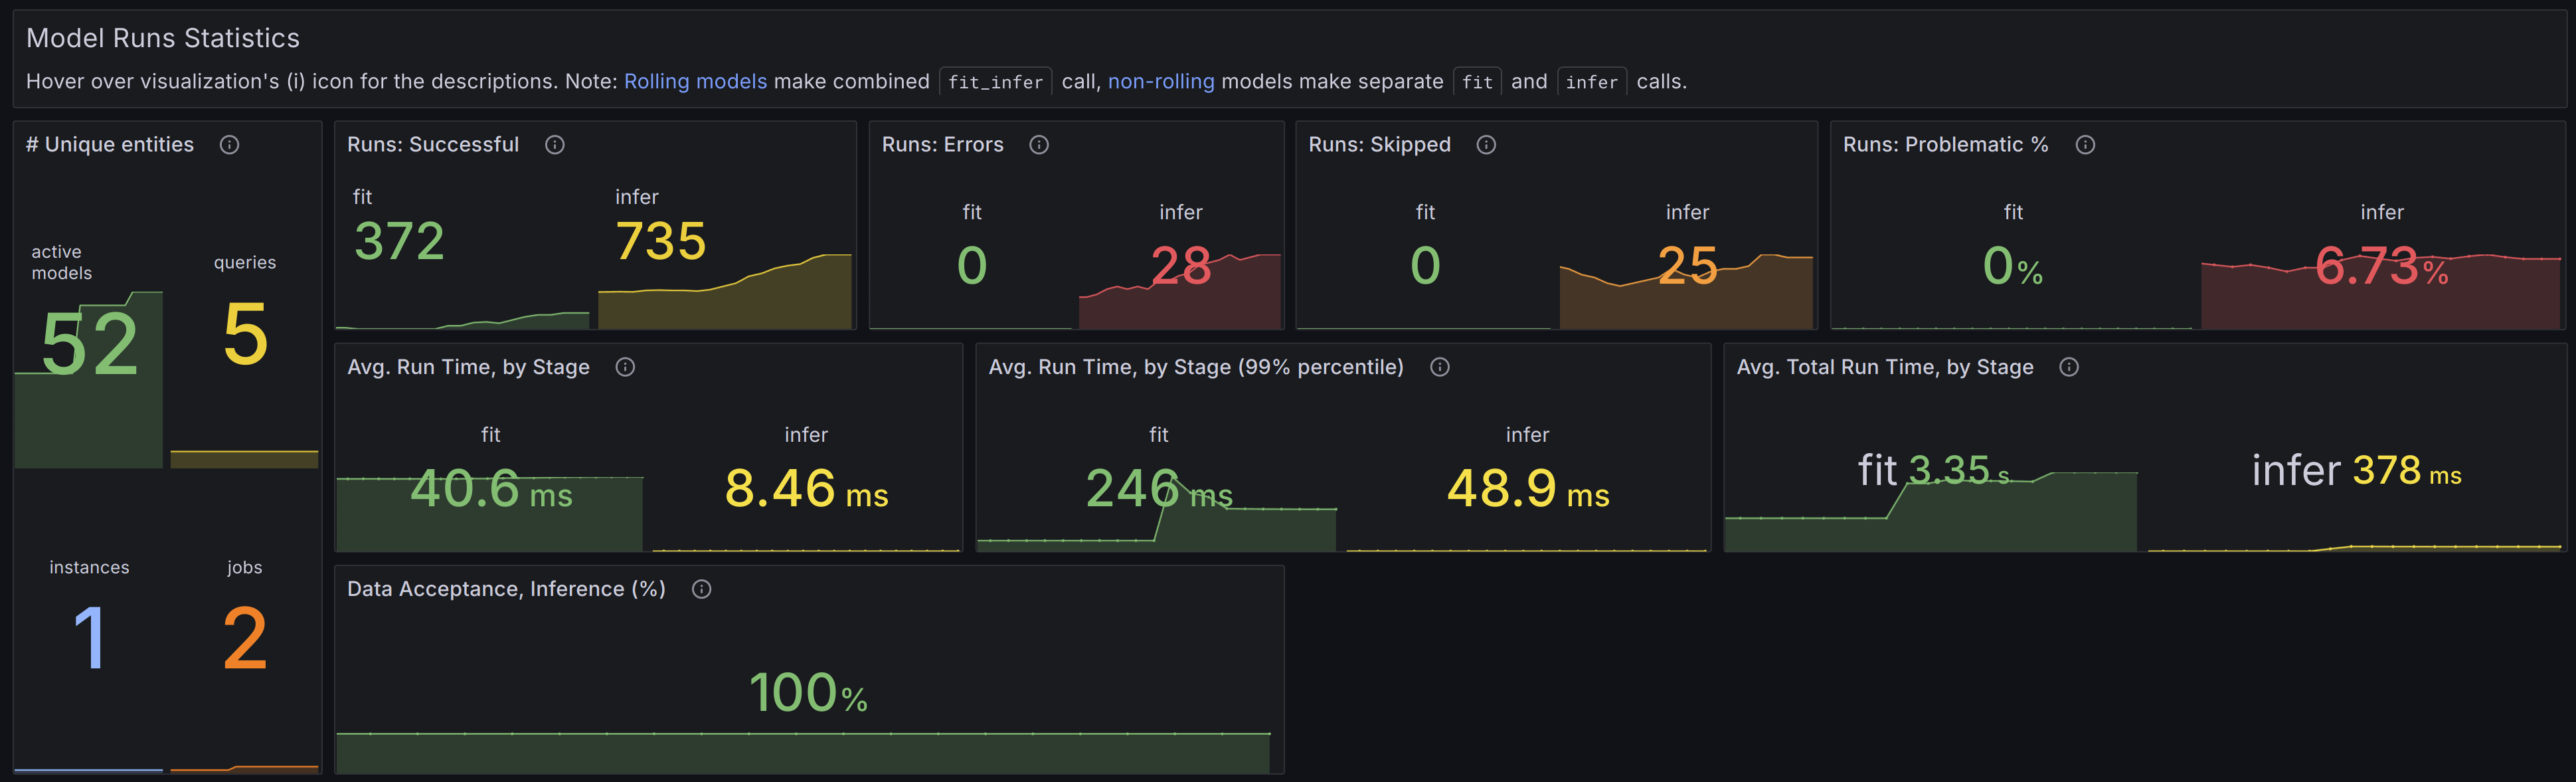
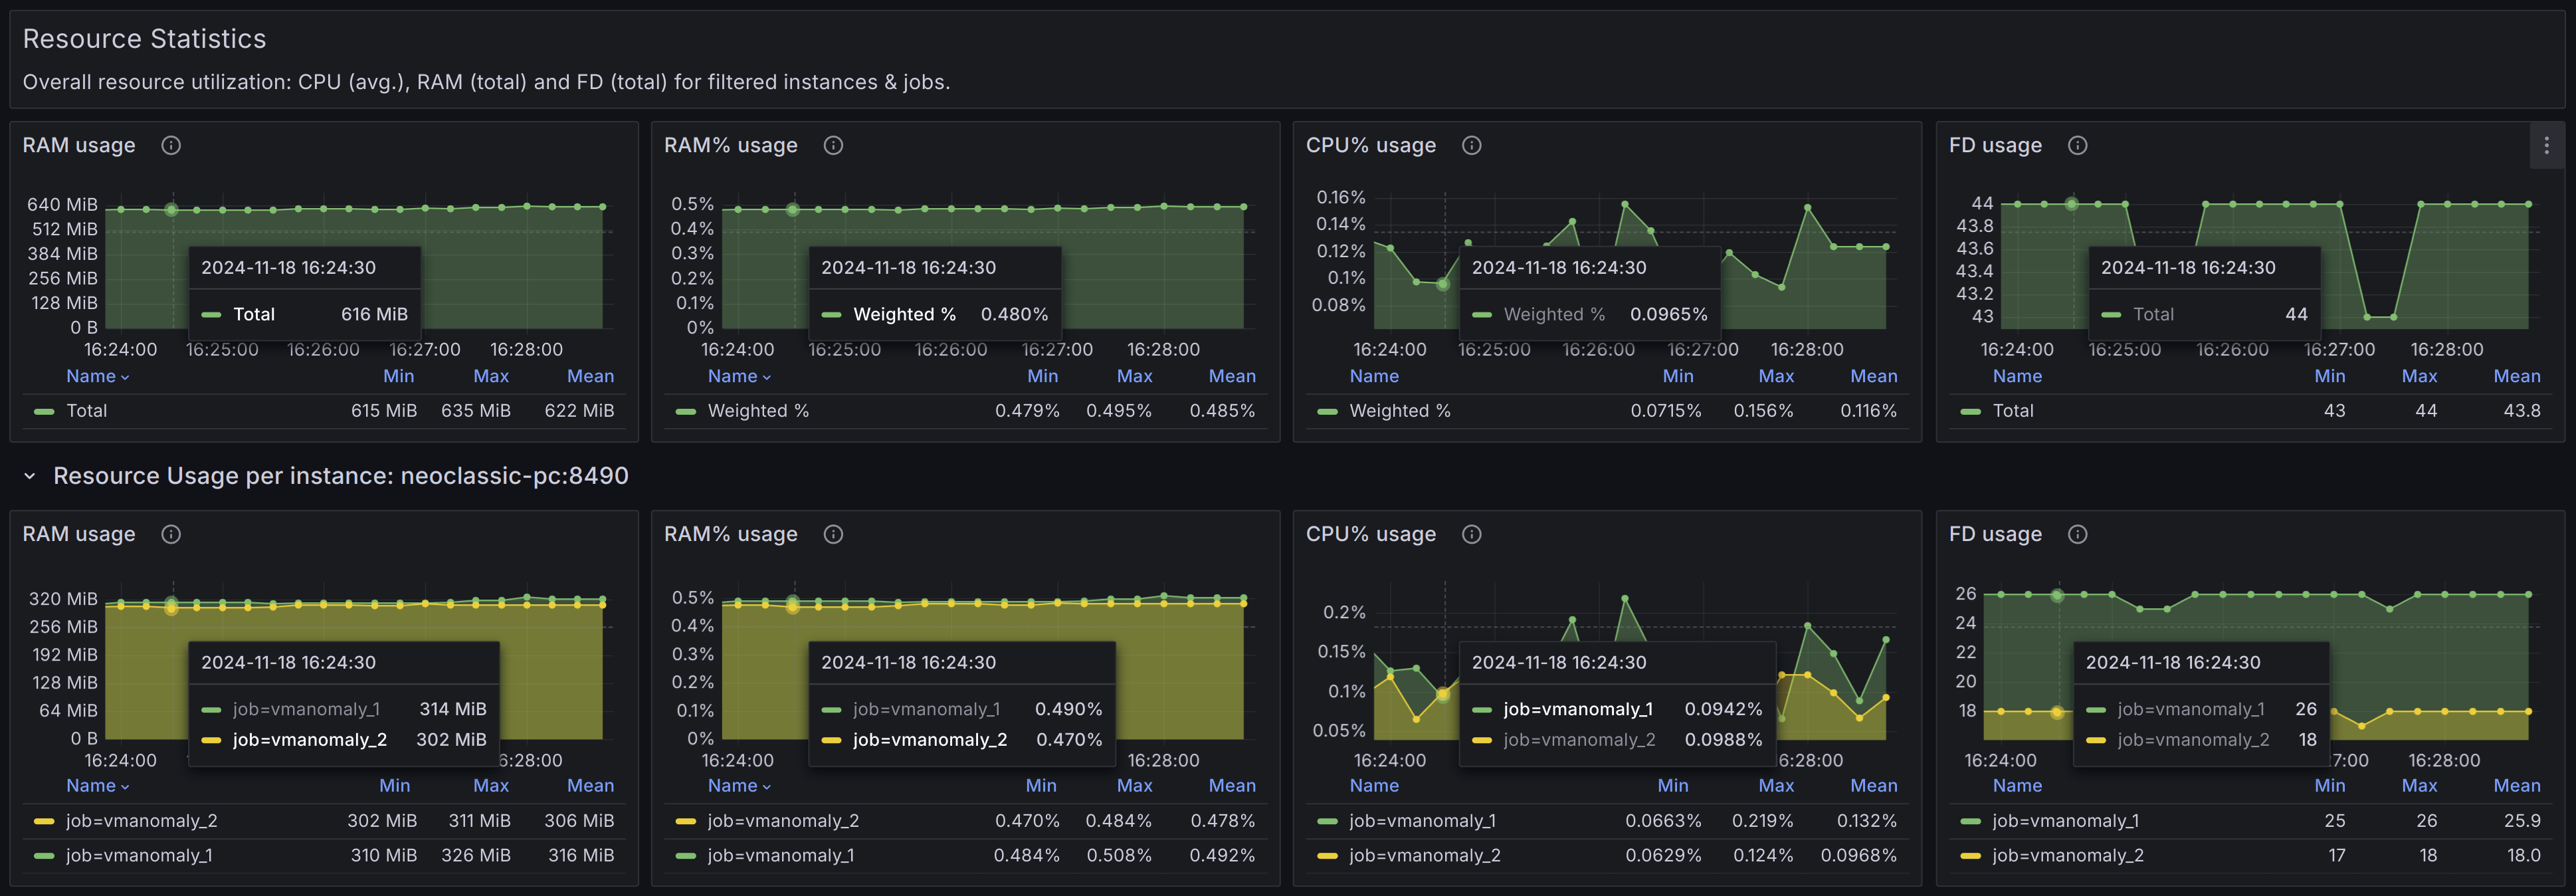
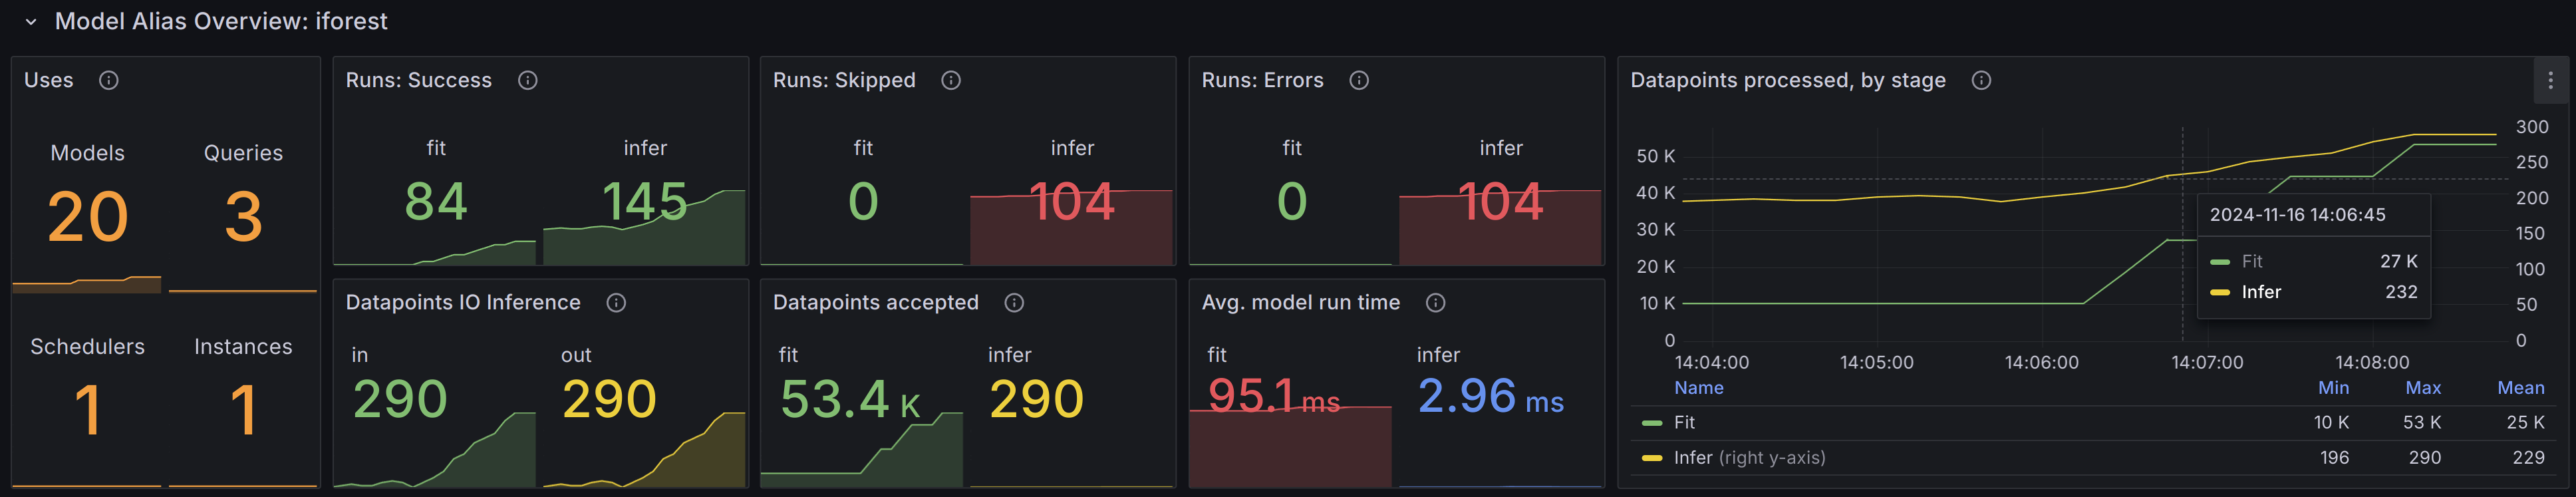
This dashboard visualizes key metrics that reflect the current state and performance of the vmanomaly service.
If you have suggestions, improvements, or bug reports, feel free to open an issue or leave a review on the dashboard.
More information about vmanomaly.
Check out the latest release notes and Docker images. Helm charts are available here.
Data source config
Collector config:
Upload an updated version of an exported dashboard.json file from Grafana
| Revision | Description | Created | |
|---|---|---|---|
| Download |