
White Cloud Security
White Cloud Security Dashboard Grafana/Prometheus
Overview
This README provides instructions on how to integrate White Cloud Security (WCS) with Grafana using the Prometheus data source. You will find examples of Prometheus scrape job configurations for collecting WCS OpenMetrics data and instructions for importing the pre-configured WCS Grafana dashboard.
Requirements
- Prometheus: Installed and configured for your environment.
- Grafana: Installed and configured with Prometheus as a data source.
- WCS OpenMetrics API: Accessible with a valid API key.
Prometheus Scrape Job Configuration
To collect metrics from the WCS OpenMetrics API, you need to add scrape jobs to your Prometheus configuration file. Below is an example of how the scrape job should be configured. Please ensure that you mask your keys and targets for security purposes when sharing configurations.
Example Scrape Jobs
- job_name: 'wcs_openmetrics'
metrics_path: /api/v1/openmetrics.php
scheme: https
static_configs:
- targets: ['<your_wcs_server>']
params:
auth: ['<your_auth_token>']
keyName: ['openmetrics']
apikey: ['<your_api_key>']
- job_name: 'wcs_openmetrics_stats_update'
scrape_interval: 5m
metrics_path: /api/v1/openmetrics.php
scheme: https
static_configs:
- targets: ['<your_wcs_server>']
params:
auth: ['<your_auth_token>']
keyName: ['openmetrics']
apikey: ['<your_api_key>']
updateStats: [1]
Explanation of Fields
- job_name: Name for the scrape job. For example,
'wcs_openmetrics'and'wcs_openmetrics_stats_update'. - metrics_path: The path on the WCS server that exposes OpenMetrics data. In this case,
/api/v1/openmetrics.php. - scheme: The protocol used for accessing the WCS server, typically
https. - static_configs: Defines the targets (i.e., the WCS server endpoints) to scrape metrics from.
- params: Additional parameters for authentication and API access, such as the
auth,keyName, andapikeyfields.
Masked Example
In the examples above, ensure to replace:
<your_wcs_server>with your actual WCS server URL.<your_auth_token>with the authentication token.<your_api_key>with your actual API key.
Grafana Dashboard Setup
Once Prometheus is configured with the WCS OpenMetrics data, you can create Grafana dashboards to visualize the metrics. The following steps outline how to set up the dashboard:
1. Add Prometheus as a Data Source
- Navigate to Configuration in Grafana.
- Click on Data Sources and select Prometheus.
- Enter the Prometheus URL (e.g.,
http://localhost:9090if Prometheus is running locally). - Save and test the connection.
2. Import the WCS Grafana Dashboard
To streamline the setup process, White Cloud Security provides a pre-configured Grafana dashboard. You can import this dashboard using the ID 22041.
Steps to Import:
- Open Grafana and navigate to Create > Import.
- In the Import via grafana.com section, enter the dashboard ID
22041and click Load. - Choose the Prometheus data source you configured earlier from the dropdown list.
- Click Import to load the dashboard into your Grafana instance.
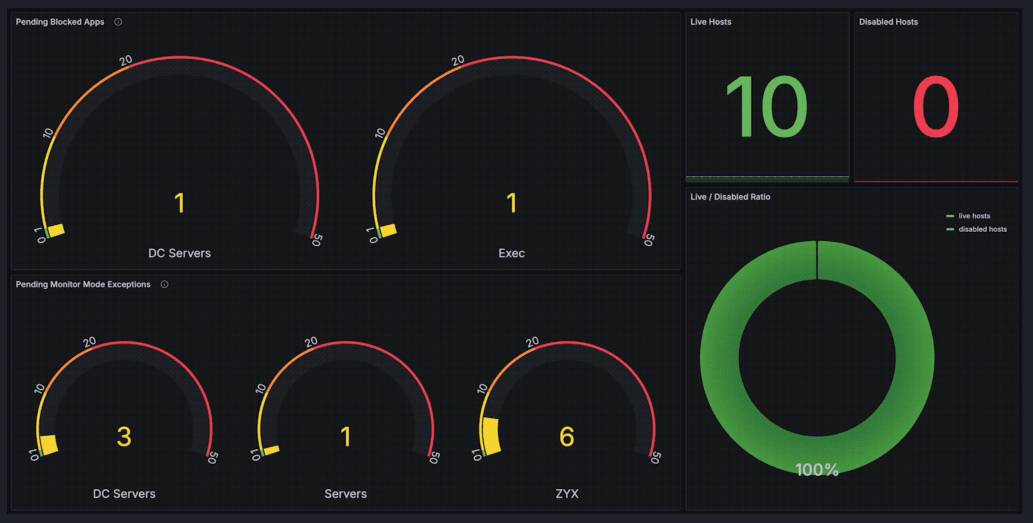
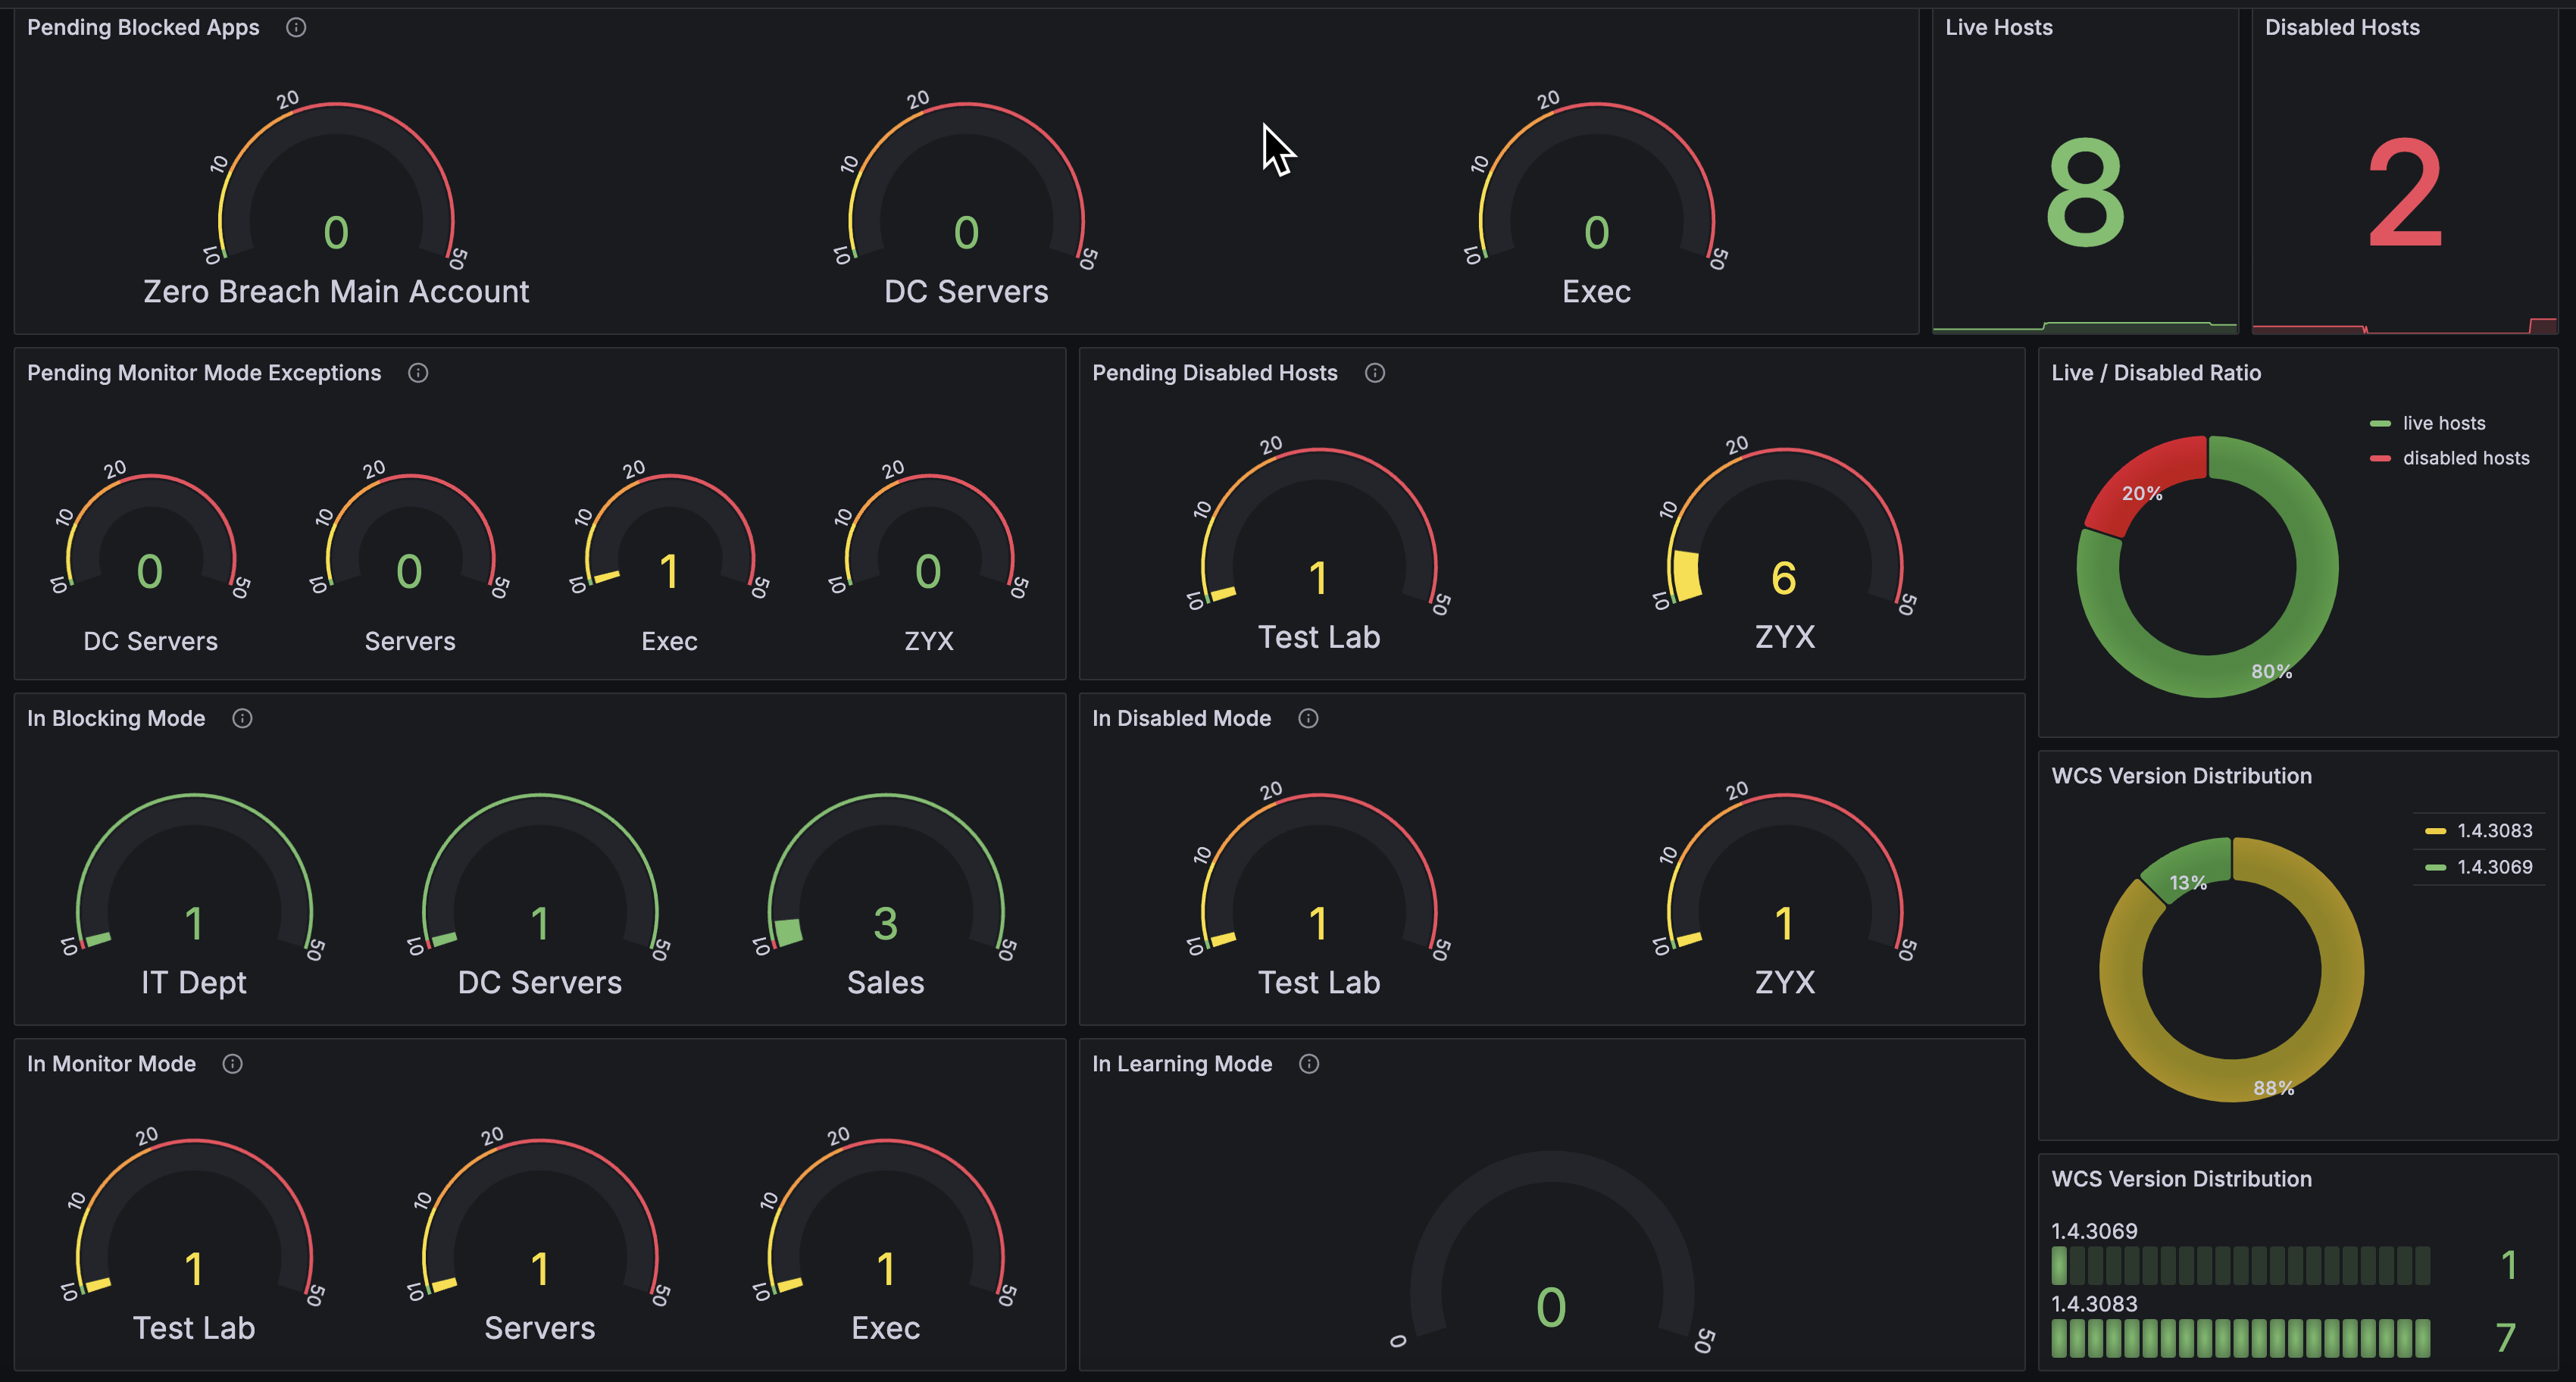
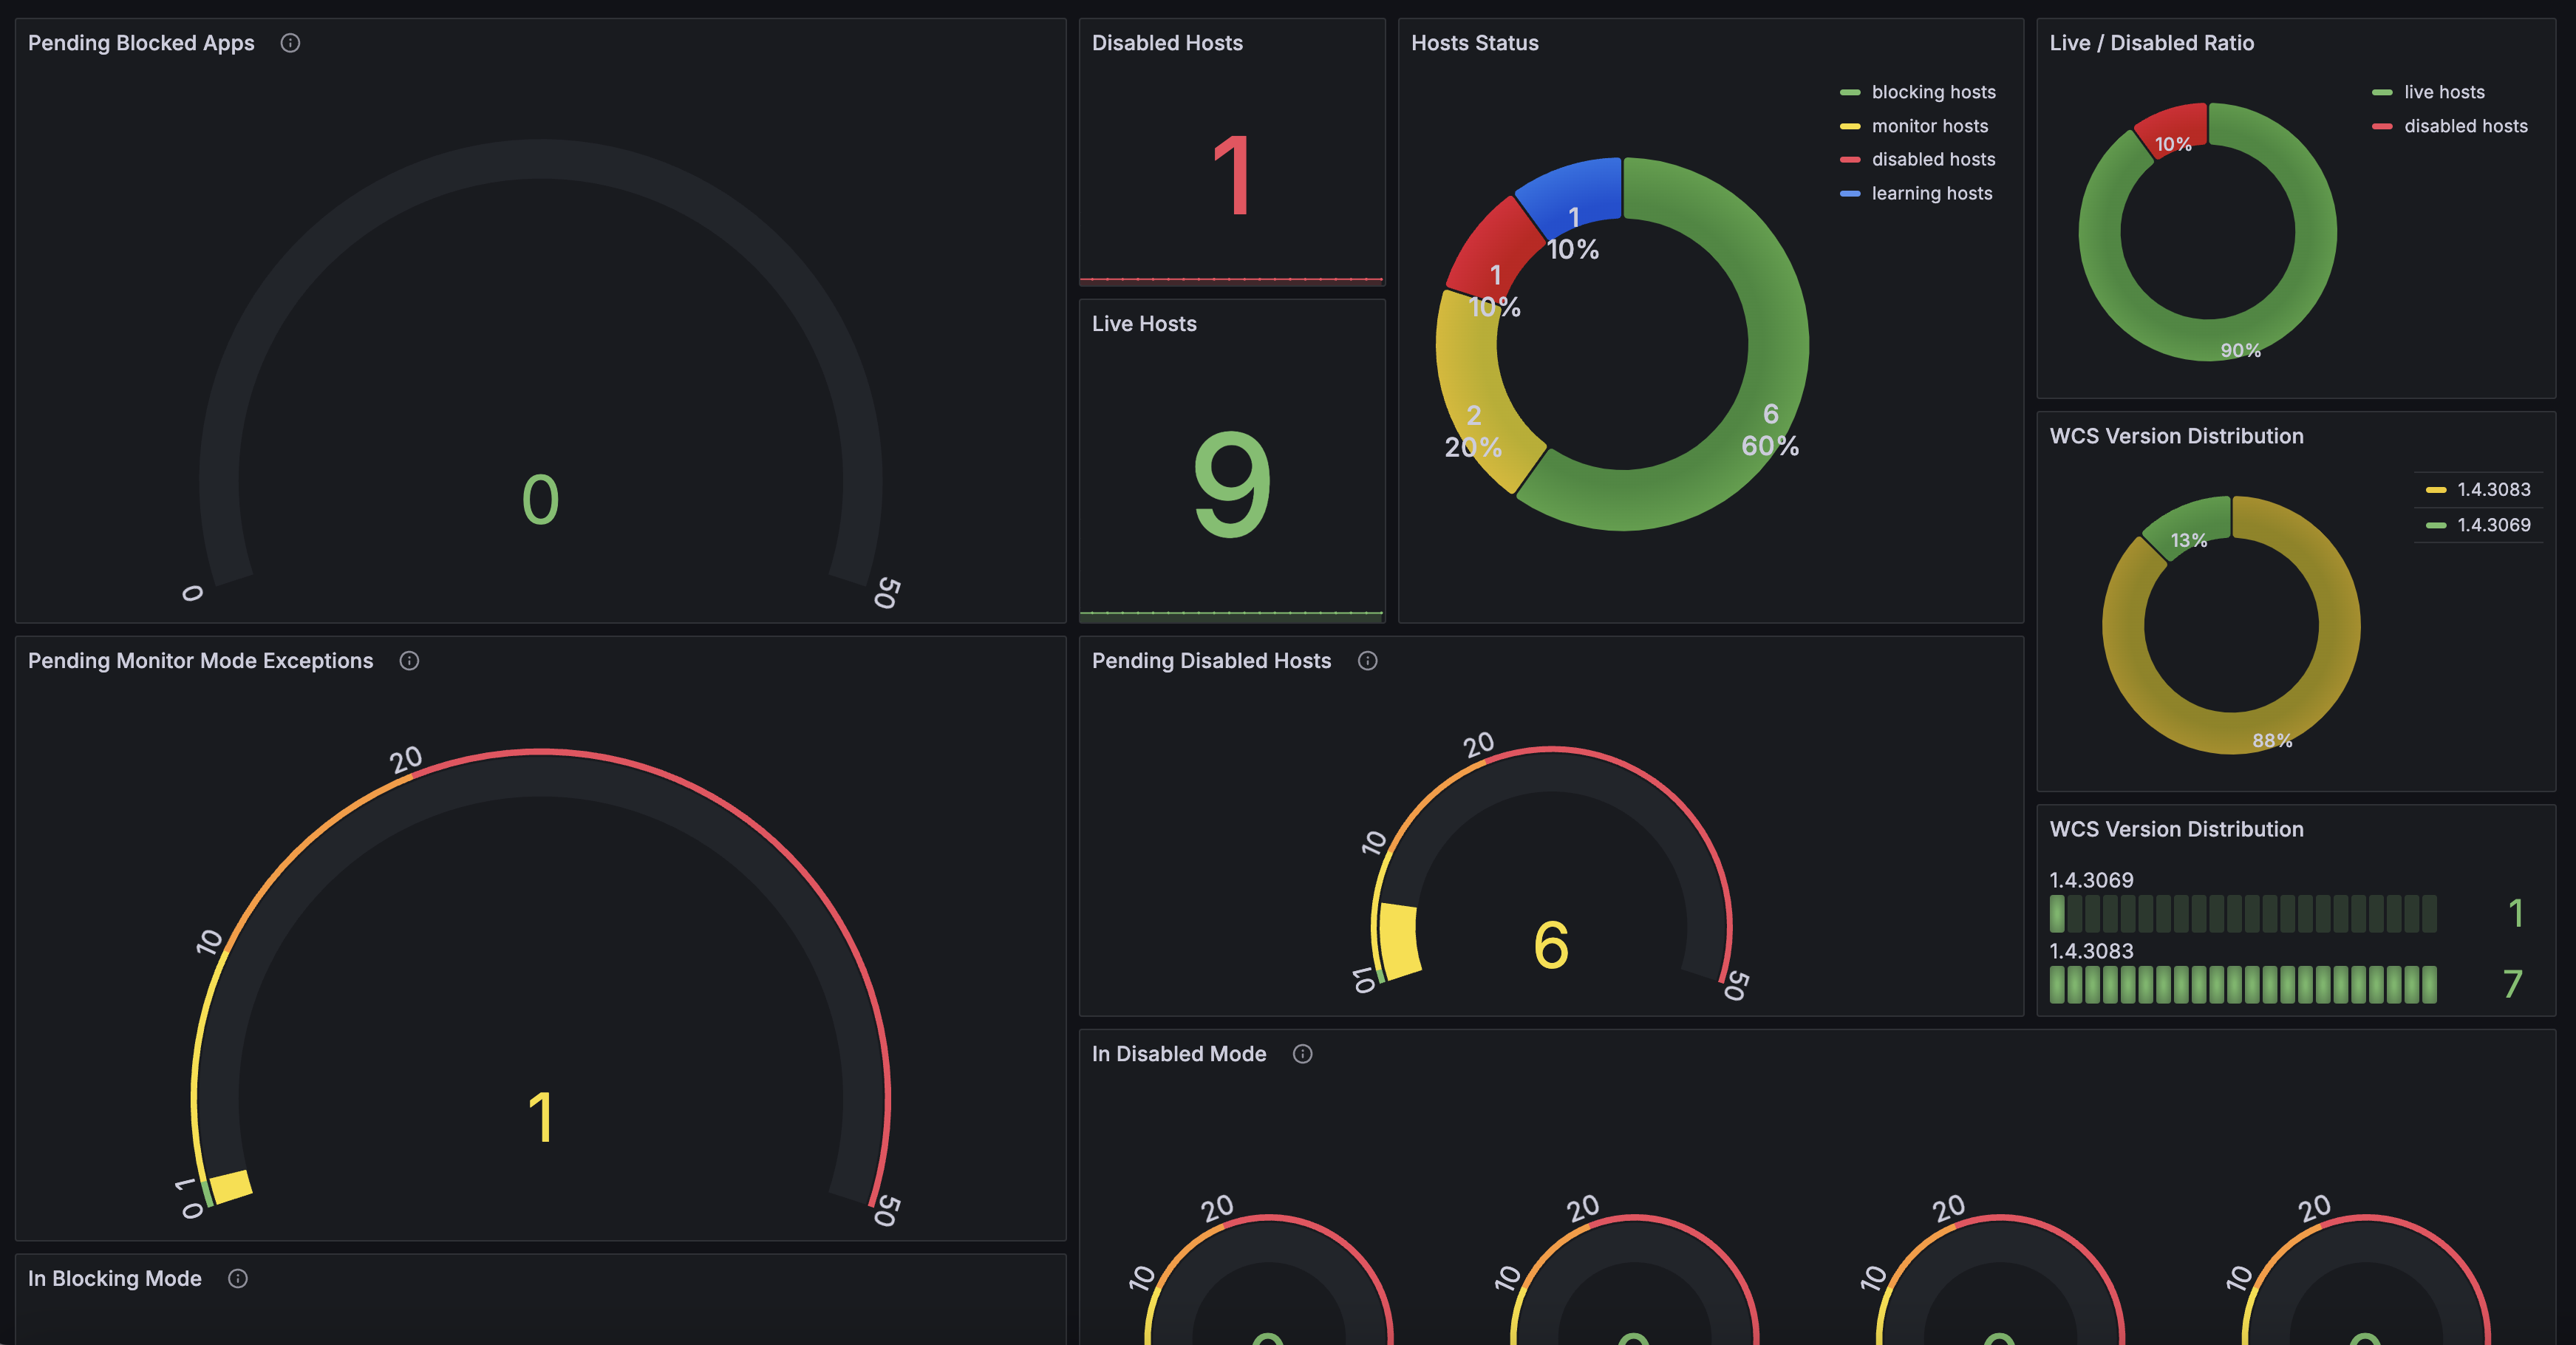
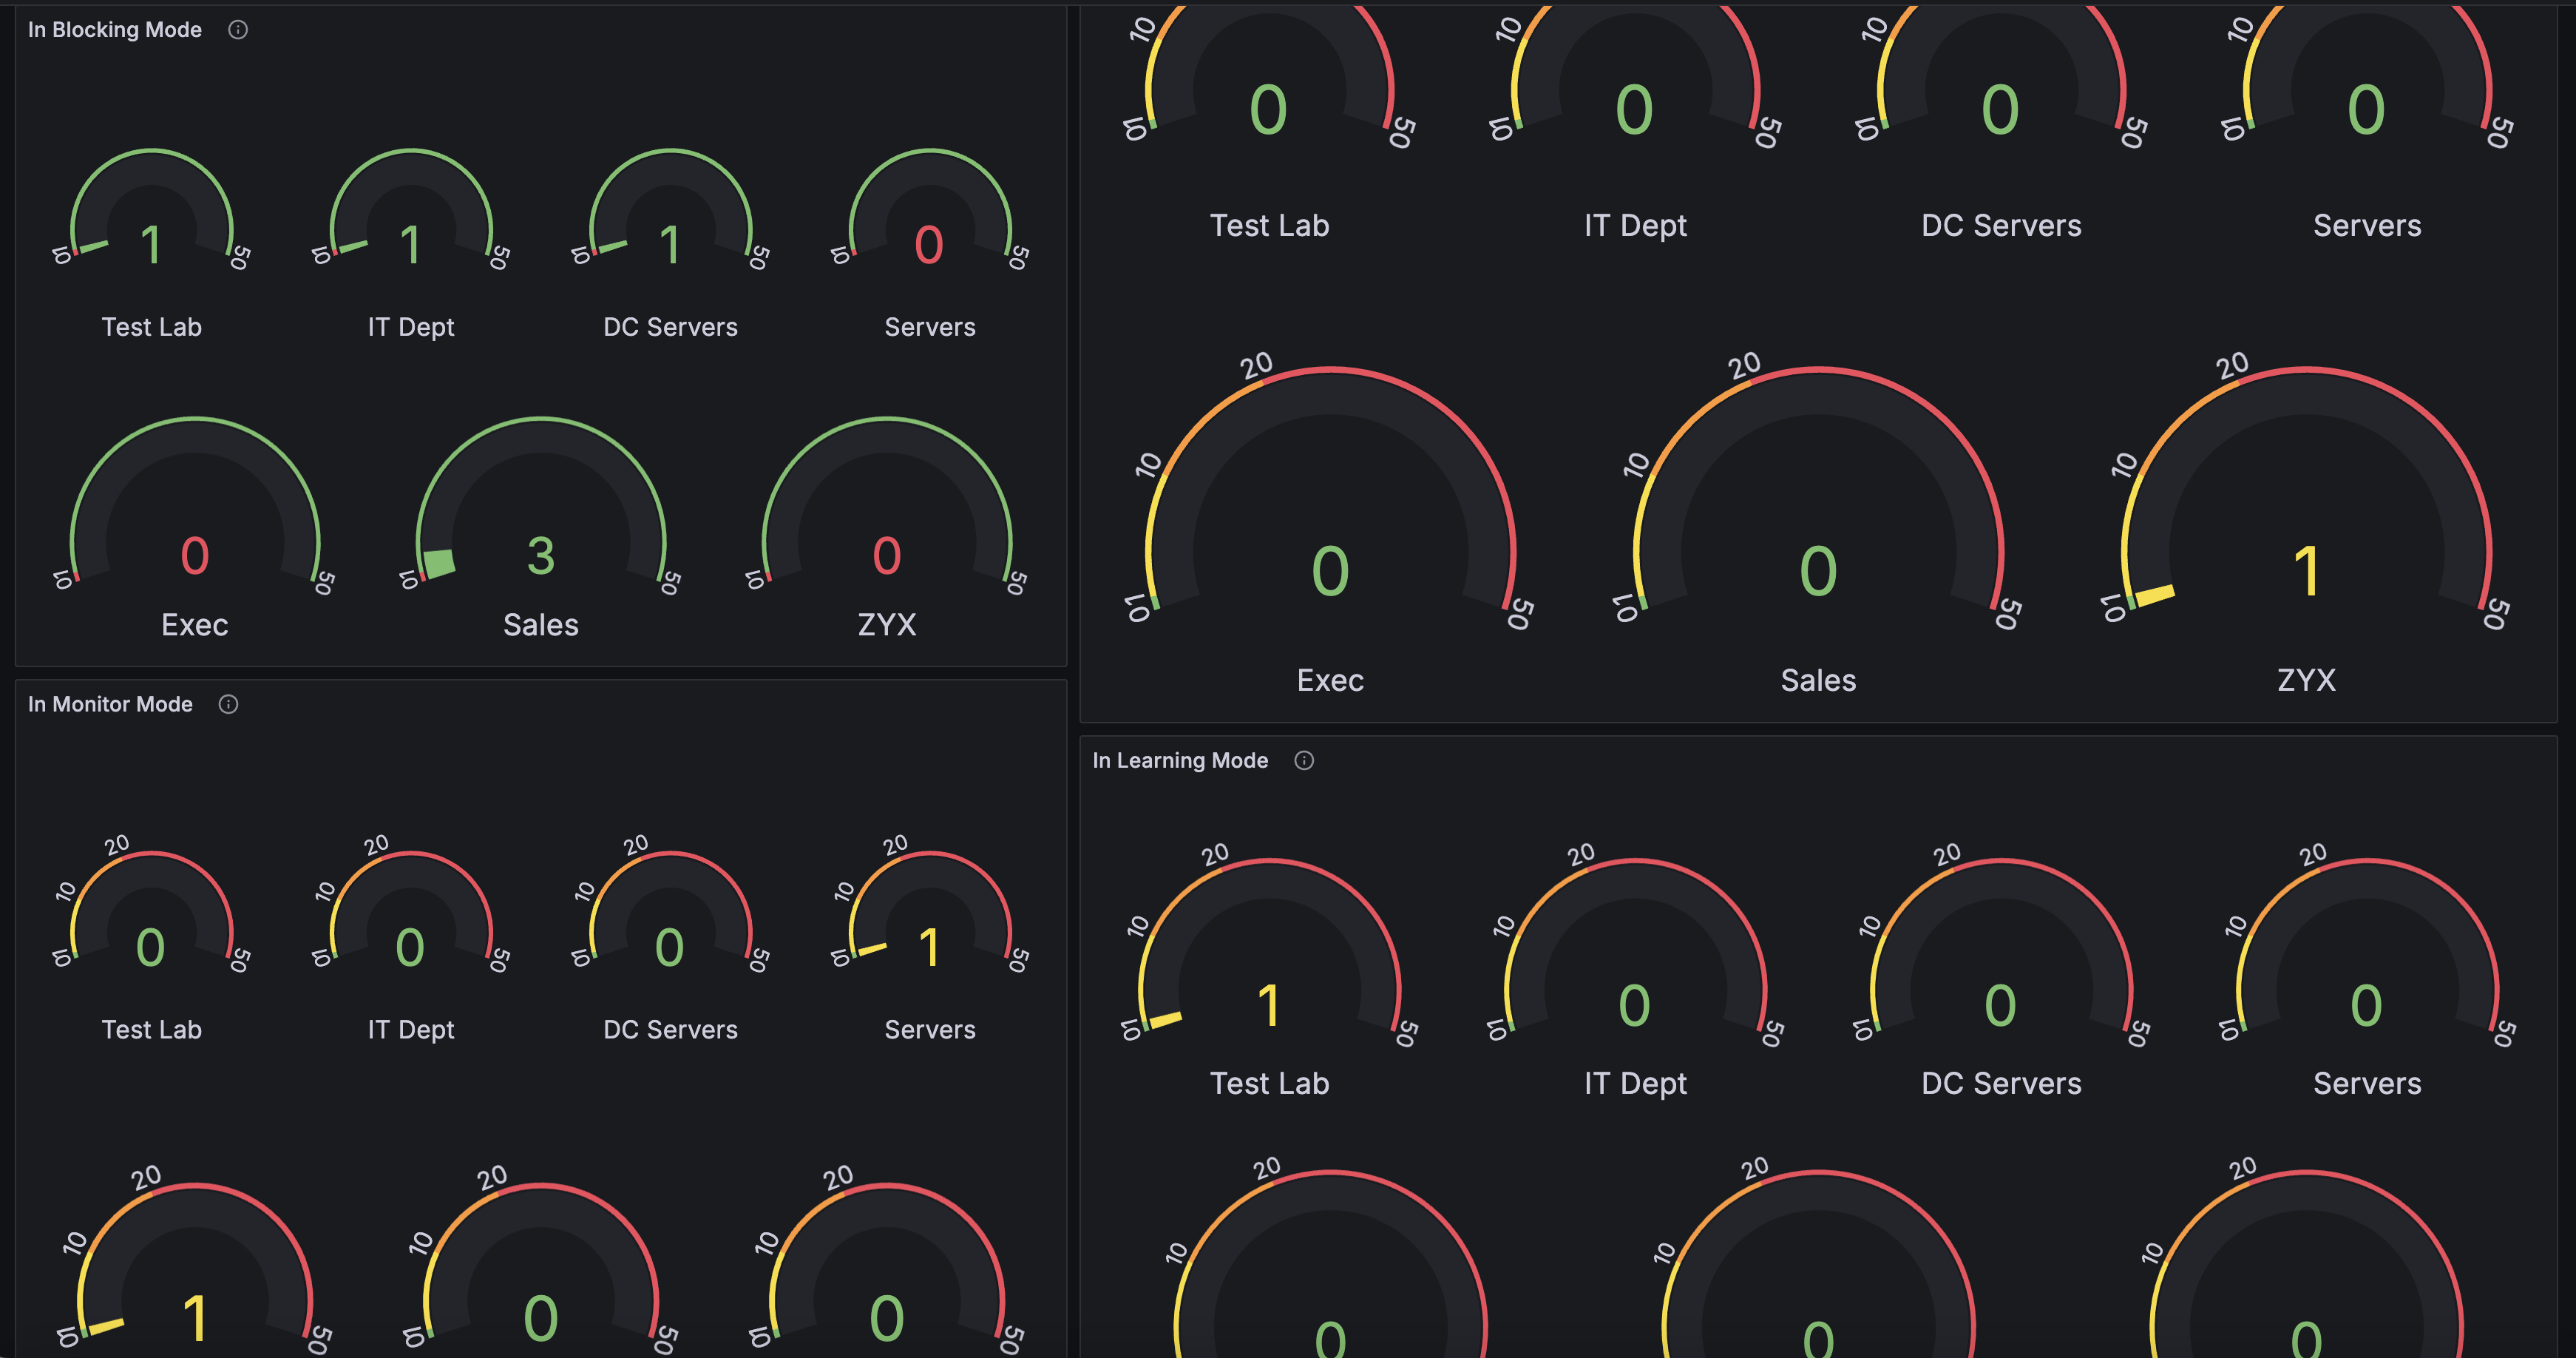
Once imported, the dashboard will display a variety of WCS-specific metrics and graphs, providing real-time insights into your security landscape.
Additional Resources
- Visit the official White Cloud Security website for more information about the product and its capabilities.
- Detailed documentation can be found at WCS Documentation to help with further configuration, troubleshooting, and advanced setup.
Conclusion
By following these steps, you will have successfully integrated White Cloud Security metrics into your Grafana dashboard using Prometheus and imported the pre-configured WCS dashboard for monitoring. This setup will provide you with a comprehensive view of WCS performance, helping you to respond to security incidents more efficiently.
For more information on WCS metrics or help with API access, please refer to the official White Cloud Security documentation or contact the support team.
Data source config
Collector config:
Upload an updated version of an exported dashboard.json file from Grafana
| Revision | Description | Created | |
|---|---|---|---|
| Download |