Node exporter single server
Dashboard to get an overview of one server
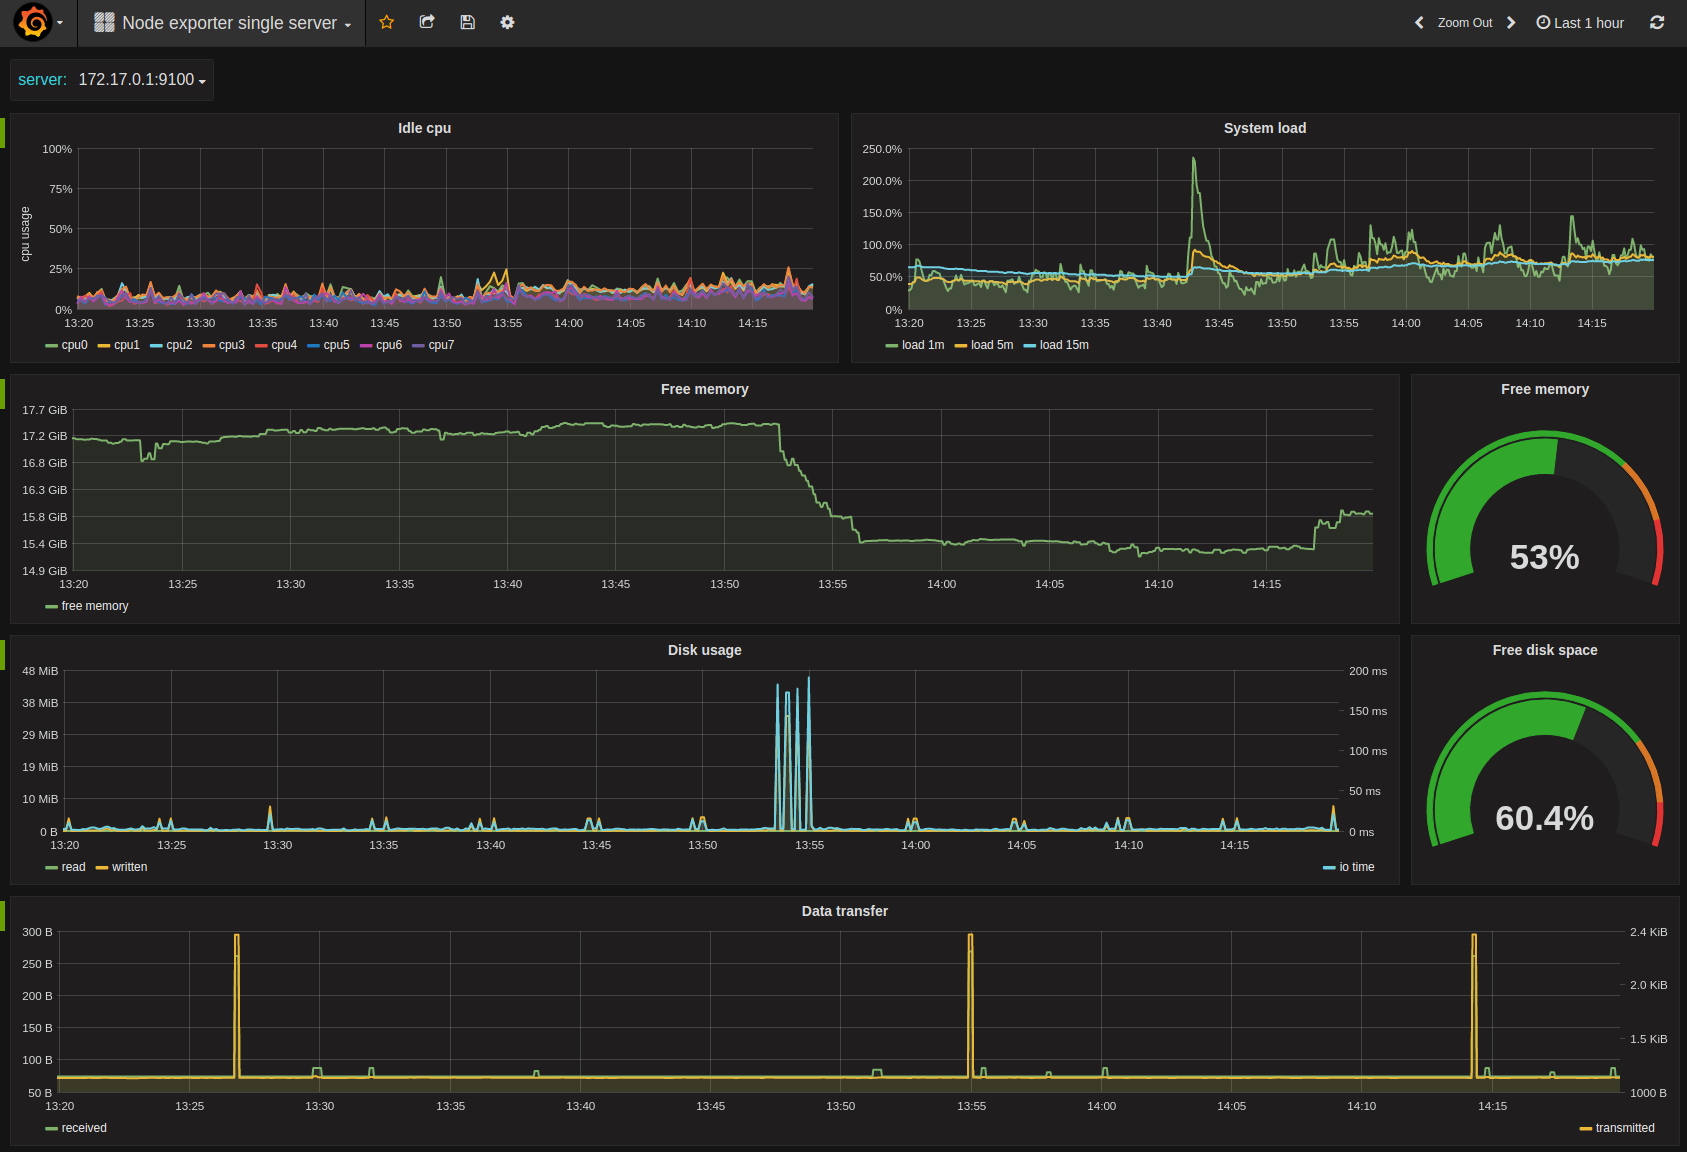
Dashboard for getting a quickly overview of a single server. Based on the data from node_exporter using default flags.
The dashboard includes
- Idle cpu per core
- System load 1m/5m/15m
- Free memory
- Disk usage from all avilable disks.
- Data transfer (received/transmitted)
Feedback
Comments? suggestions? Please open issues/pull requests to https://github.com/bergquist/dashboards
Data source config
Collector type:
Collector plugins:
Collector config:
Revisions
Upload an updated version of an exported dashboard.json file from Grafana
| Revision | Description | Created | |
|---|---|---|---|
| Download |
Linux Server
Monitor Linux with Grafana. Easily monitor your Linux deployment with Grafana Cloud's out-of-the-box monitoring solution.
Learn more