
sFlow-RT Dropped Packets
Trend network wide dropped packet notifications.
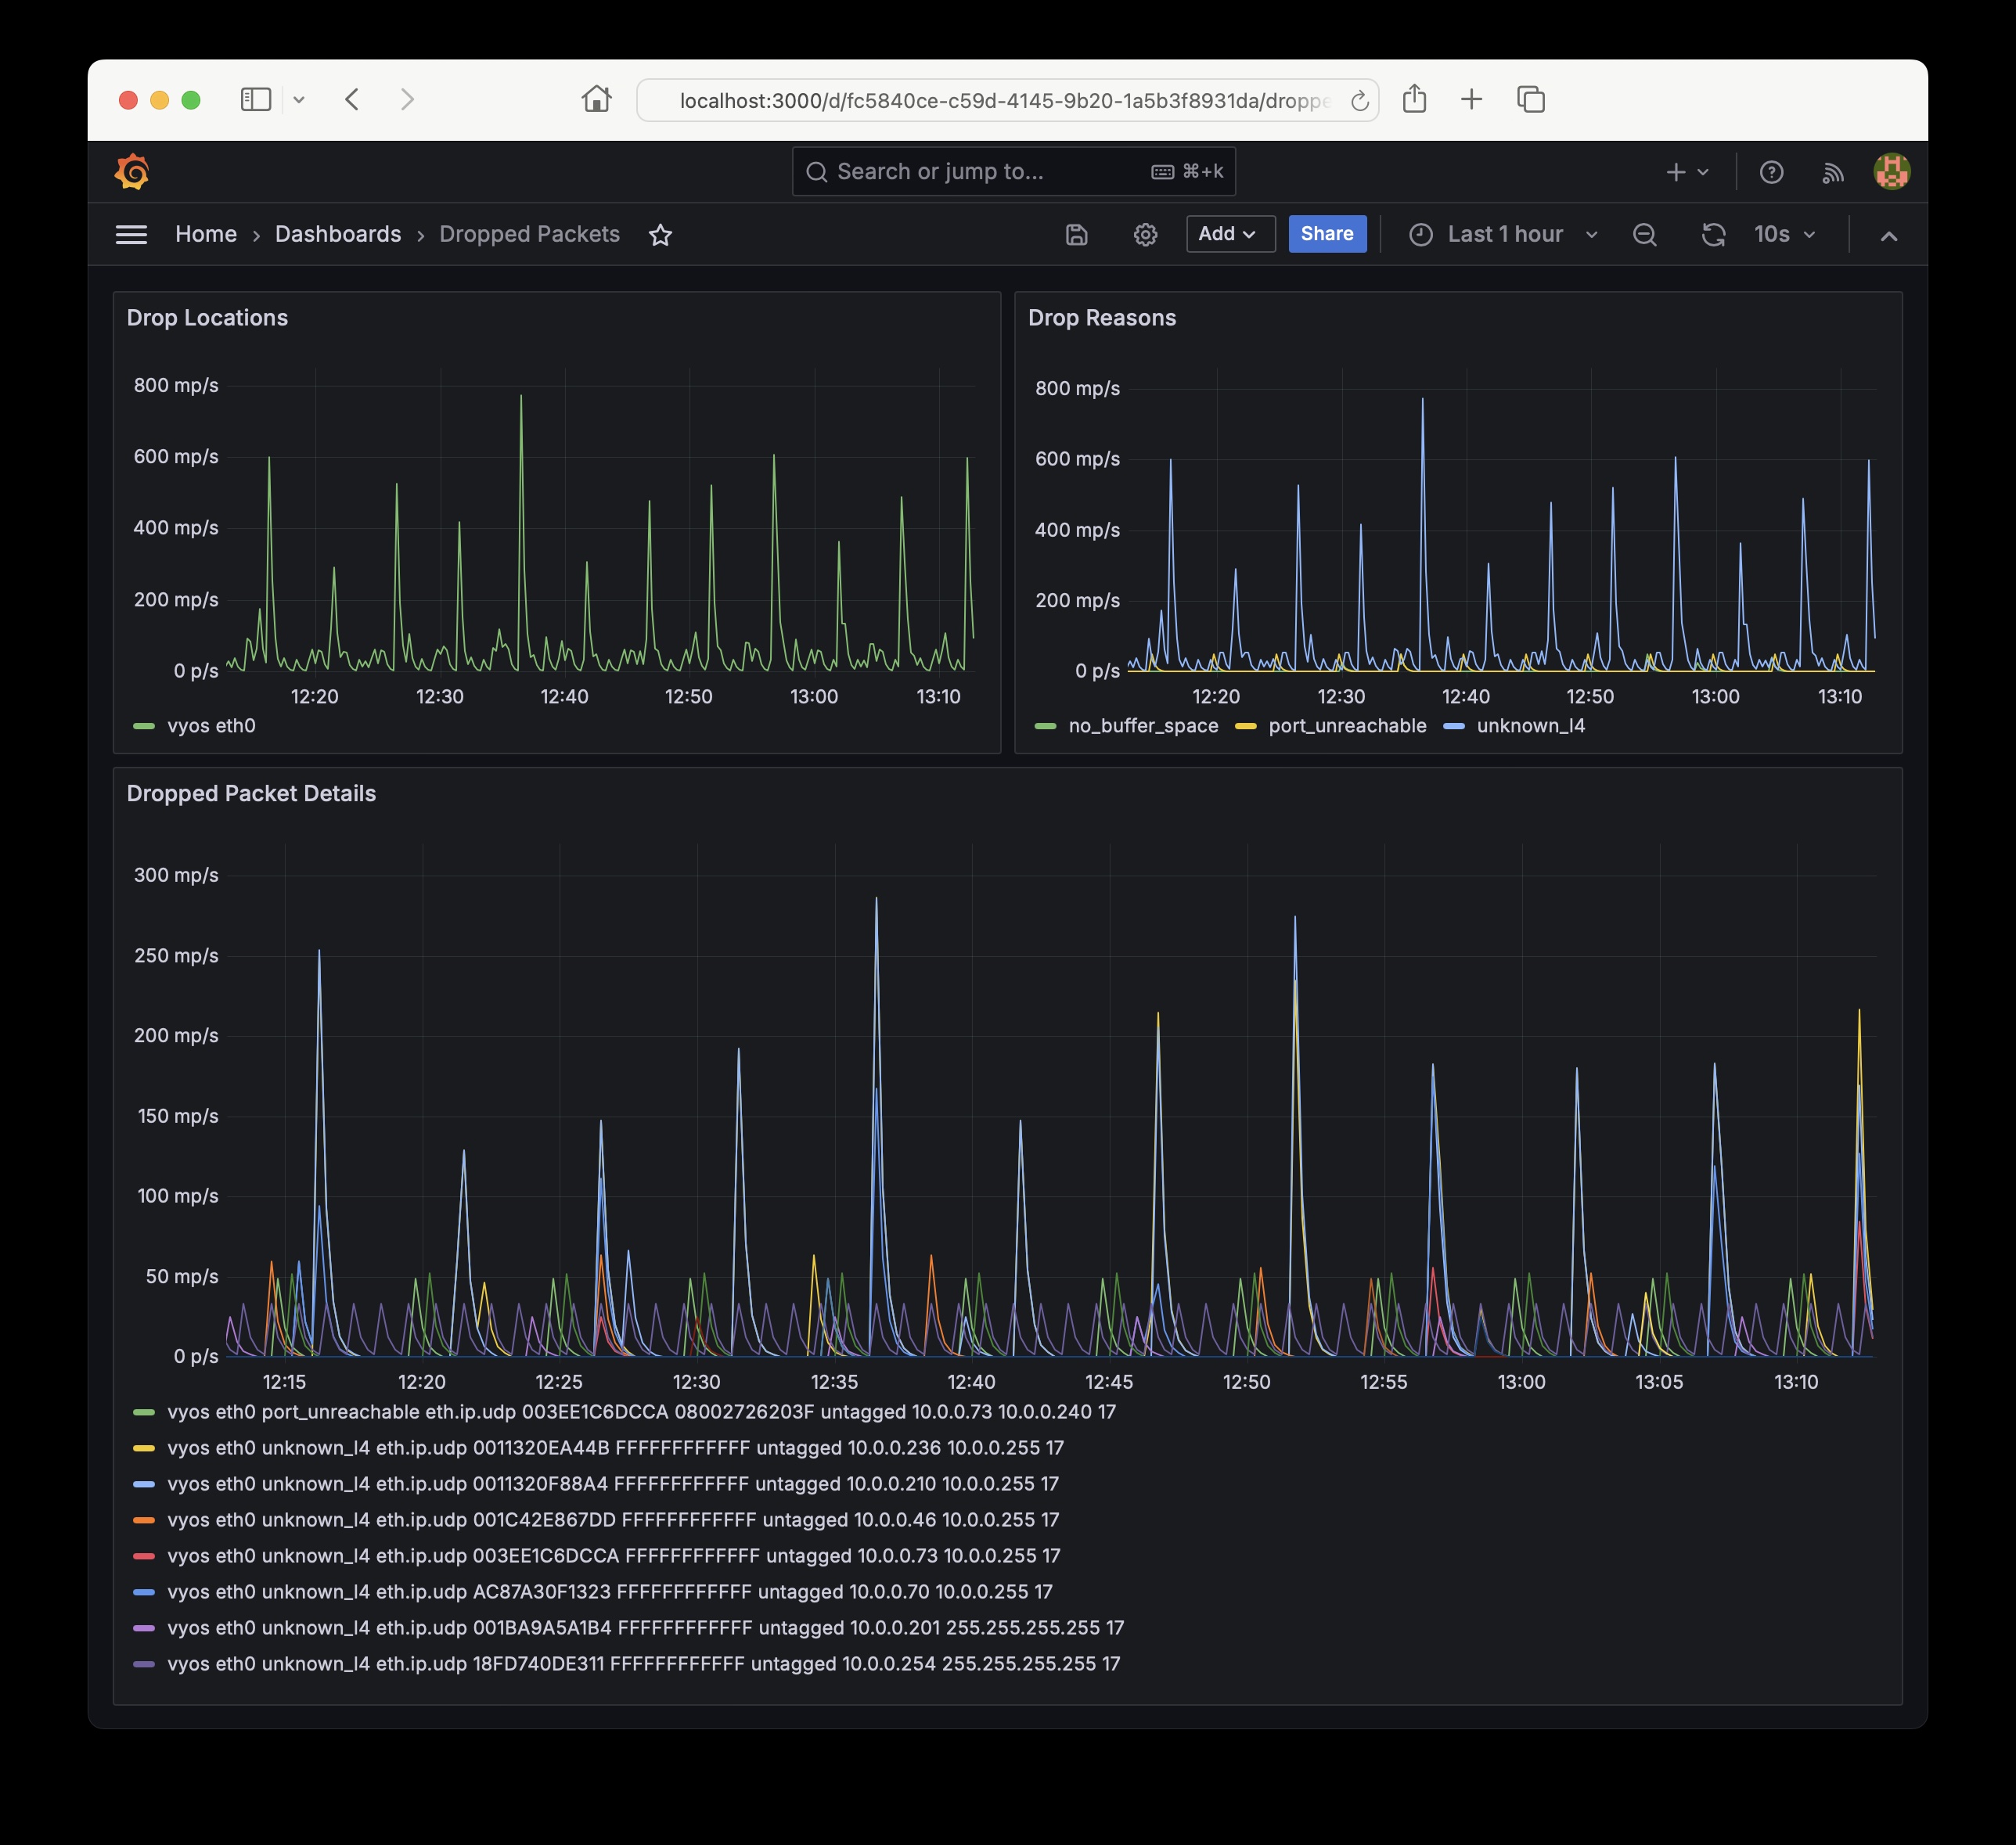
This dashboard trends packet drop notifications reported by sFlow-RT analyzer. The sFlow-RT analysis software collects streaming telemetry from industry standard sFlow Agents embedded in network devices.
Use the sflow/prometheus image to run sFlow-RT using Docker:
docker run -d -p 6343:6343/udp -p 8008:8008 sflow/prometheus
To enable SNMP to retrieve network device interface and system names, add the following option:
docker run -d -p 6343:6343/udp -p 8008:8008 sflow/prometheus -Dsnmp.ifname=yes
Use the following Prometheus scrape configuration to collect the metrics from sFlow-RT:
  - job_name: sflow-rt-drops
    metrics_path: /app/prometheus/scripts/export.js/flows/ALL/txt
    static_configs:
      - targets: ['sflow-rt:8008']
    params:
      metric: ['dropped_packets']
      key:
        - 'node:inputifindex'
        - 'ifname:inputifindex'
        - 'reason'
        - 'stack'
        - 'macsource'
        - 'macdestination'
        - 'null:vlan:untagged'
        - 'null:[or:ipsource:ip6source]:none'
        - 'null:[or:ipdestination:ip6destination]:none'
        - 'null:[or:icmptype:icmp6type:ipprotocol:ip6nexthdr]:none'
      label:
        - 'switch'
        - 'port'
        - 'reason'
        - 'stack'
        - 'macsource'
        - 'macdestination'
        - 'vlan'
        - 'src'
        - 'dst'
        - 'protocol'
      value: ['frames']
      dropped: ['true']
      maxFlows: ['20']
      minValue: ['0.001']
Data source config
Collector type:
Collector plugins:
Collector config:
Revisions
Upload an updated version of an exported dashboard.json file from Grafana
| Revision | Description | Created | |
|---|---|---|---|
| Download |