
App Developer Dashboard
App Developer Dashboard
Short Description
This dashboard is useful for an app developer who may wish to know more about their API metrics in terms of requests, latency and errors. It will show how many requests were successful, and how many failed. It will also show latency in percentiles so the developer can understand how responsive their API is.
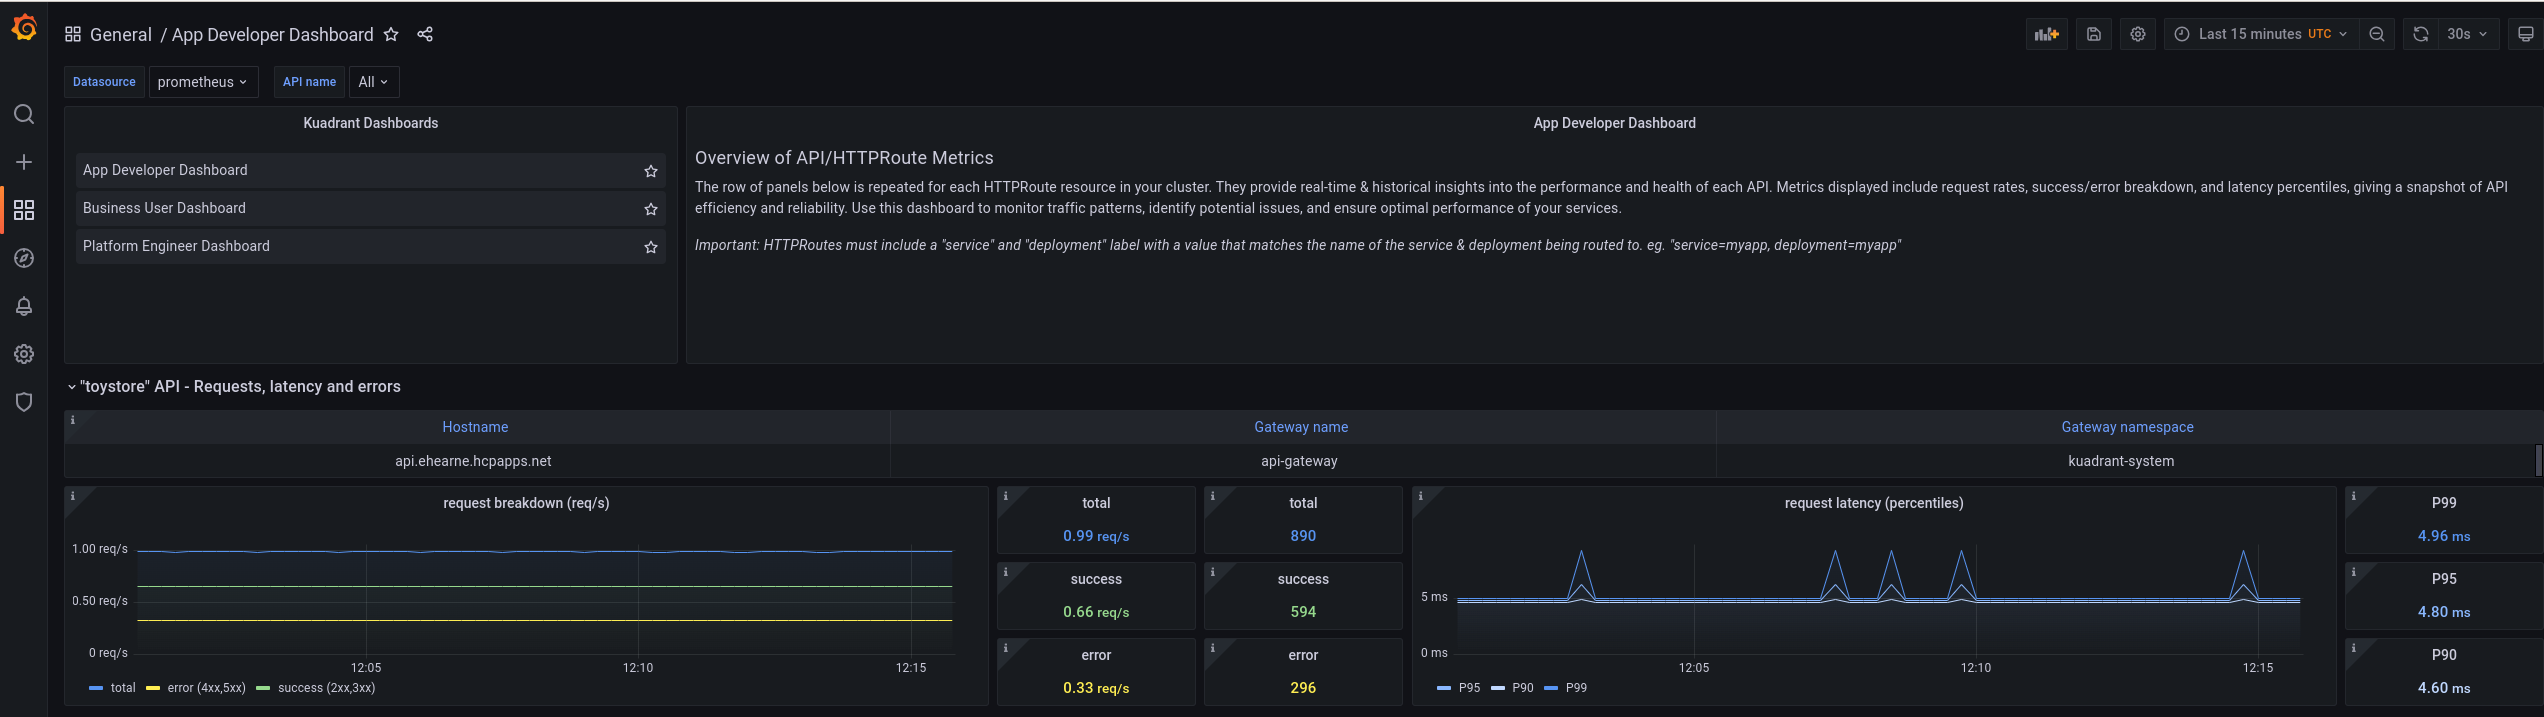
Overview of API/HTTPRoute Metrics
The row of panels below is repeated for each HTTPRoute resource in your cluster. They provide real-time & historical insights into the performance and health of each API. Metrics displayed include request rates, success/error breakdown, and latency percentiles, giving a snapshot of API efficiency and reliability. Use this dashboard to monitor traffic patterns, identify potential issues, and ensure optimal performance of your services.
Important: HTTPRoutes must include a “service” and “deployment” label with a value that matches the name of the service & deployment being routed to. eg. “service=myapp, deployment=myapp”
Data source config
Collector config:
Upload an updated version of an exported dashboard.json file from Grafana
| Revision | Description | Created | |
|---|---|---|---|
| Download |