
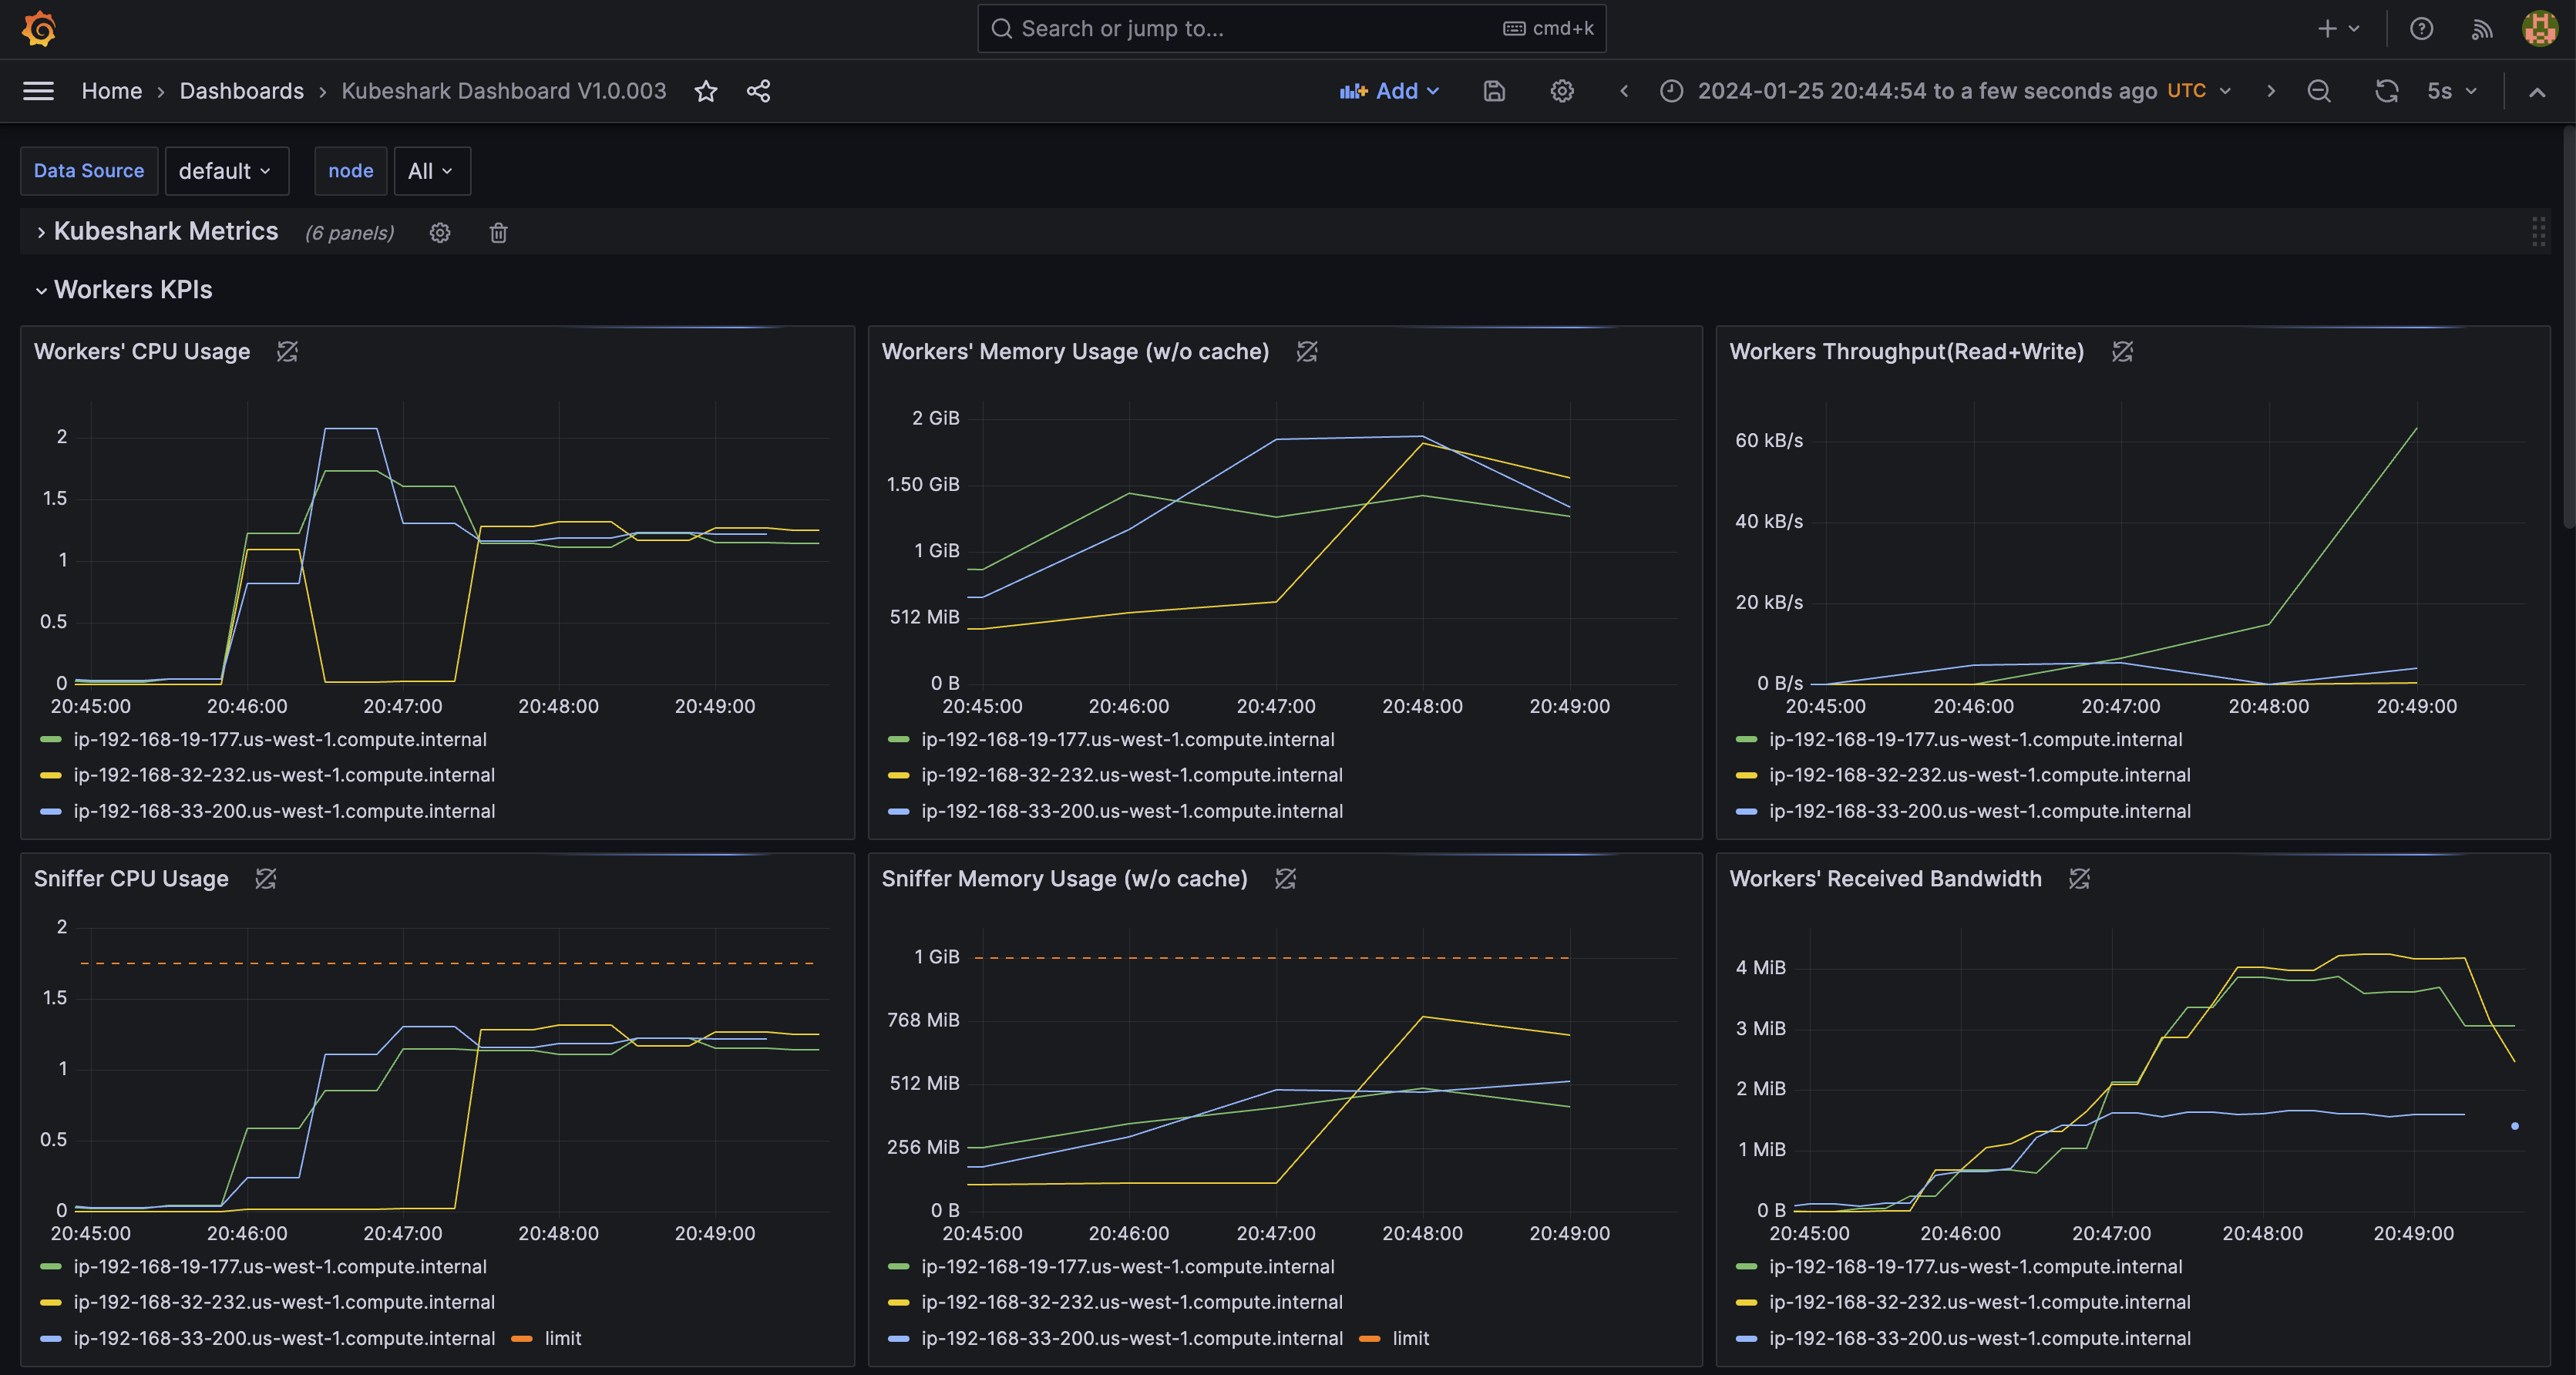
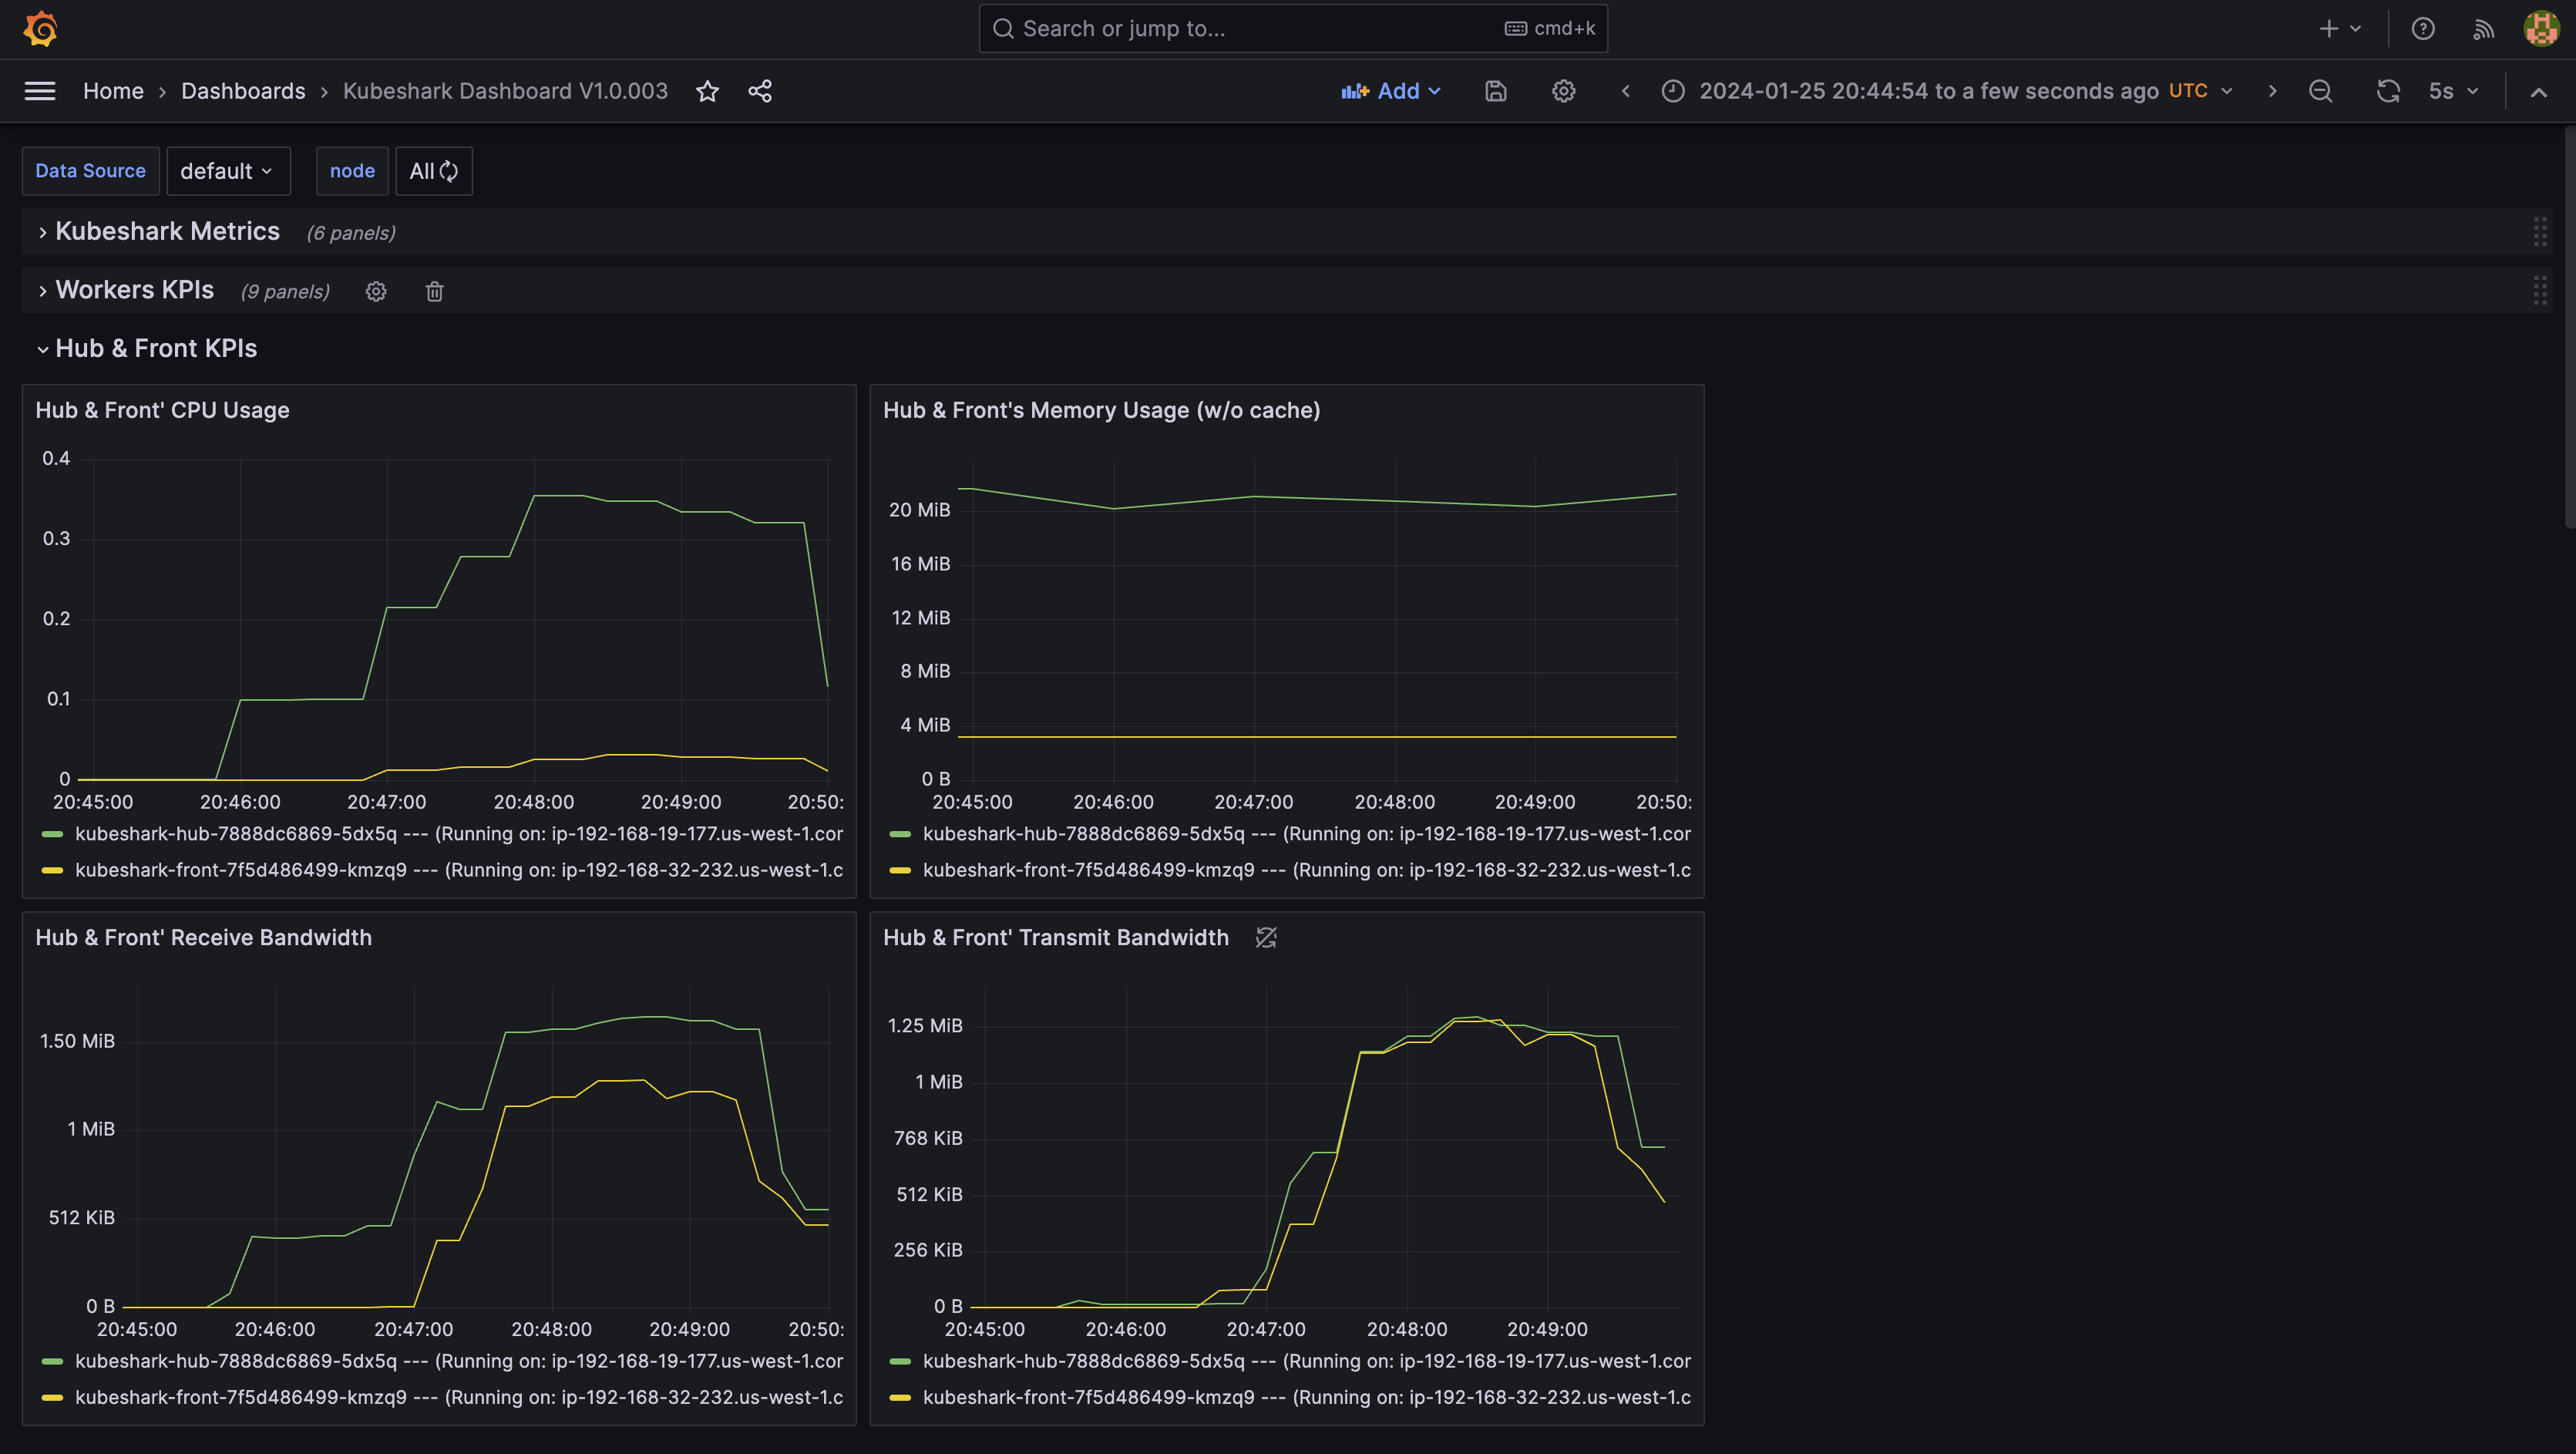
Kubeshark Dashboard v3.10
This dashboard provides a holistic view of Kubeshark resource consumption, in addition to custom metrics that offer insights into what Kubeshark is doing internally
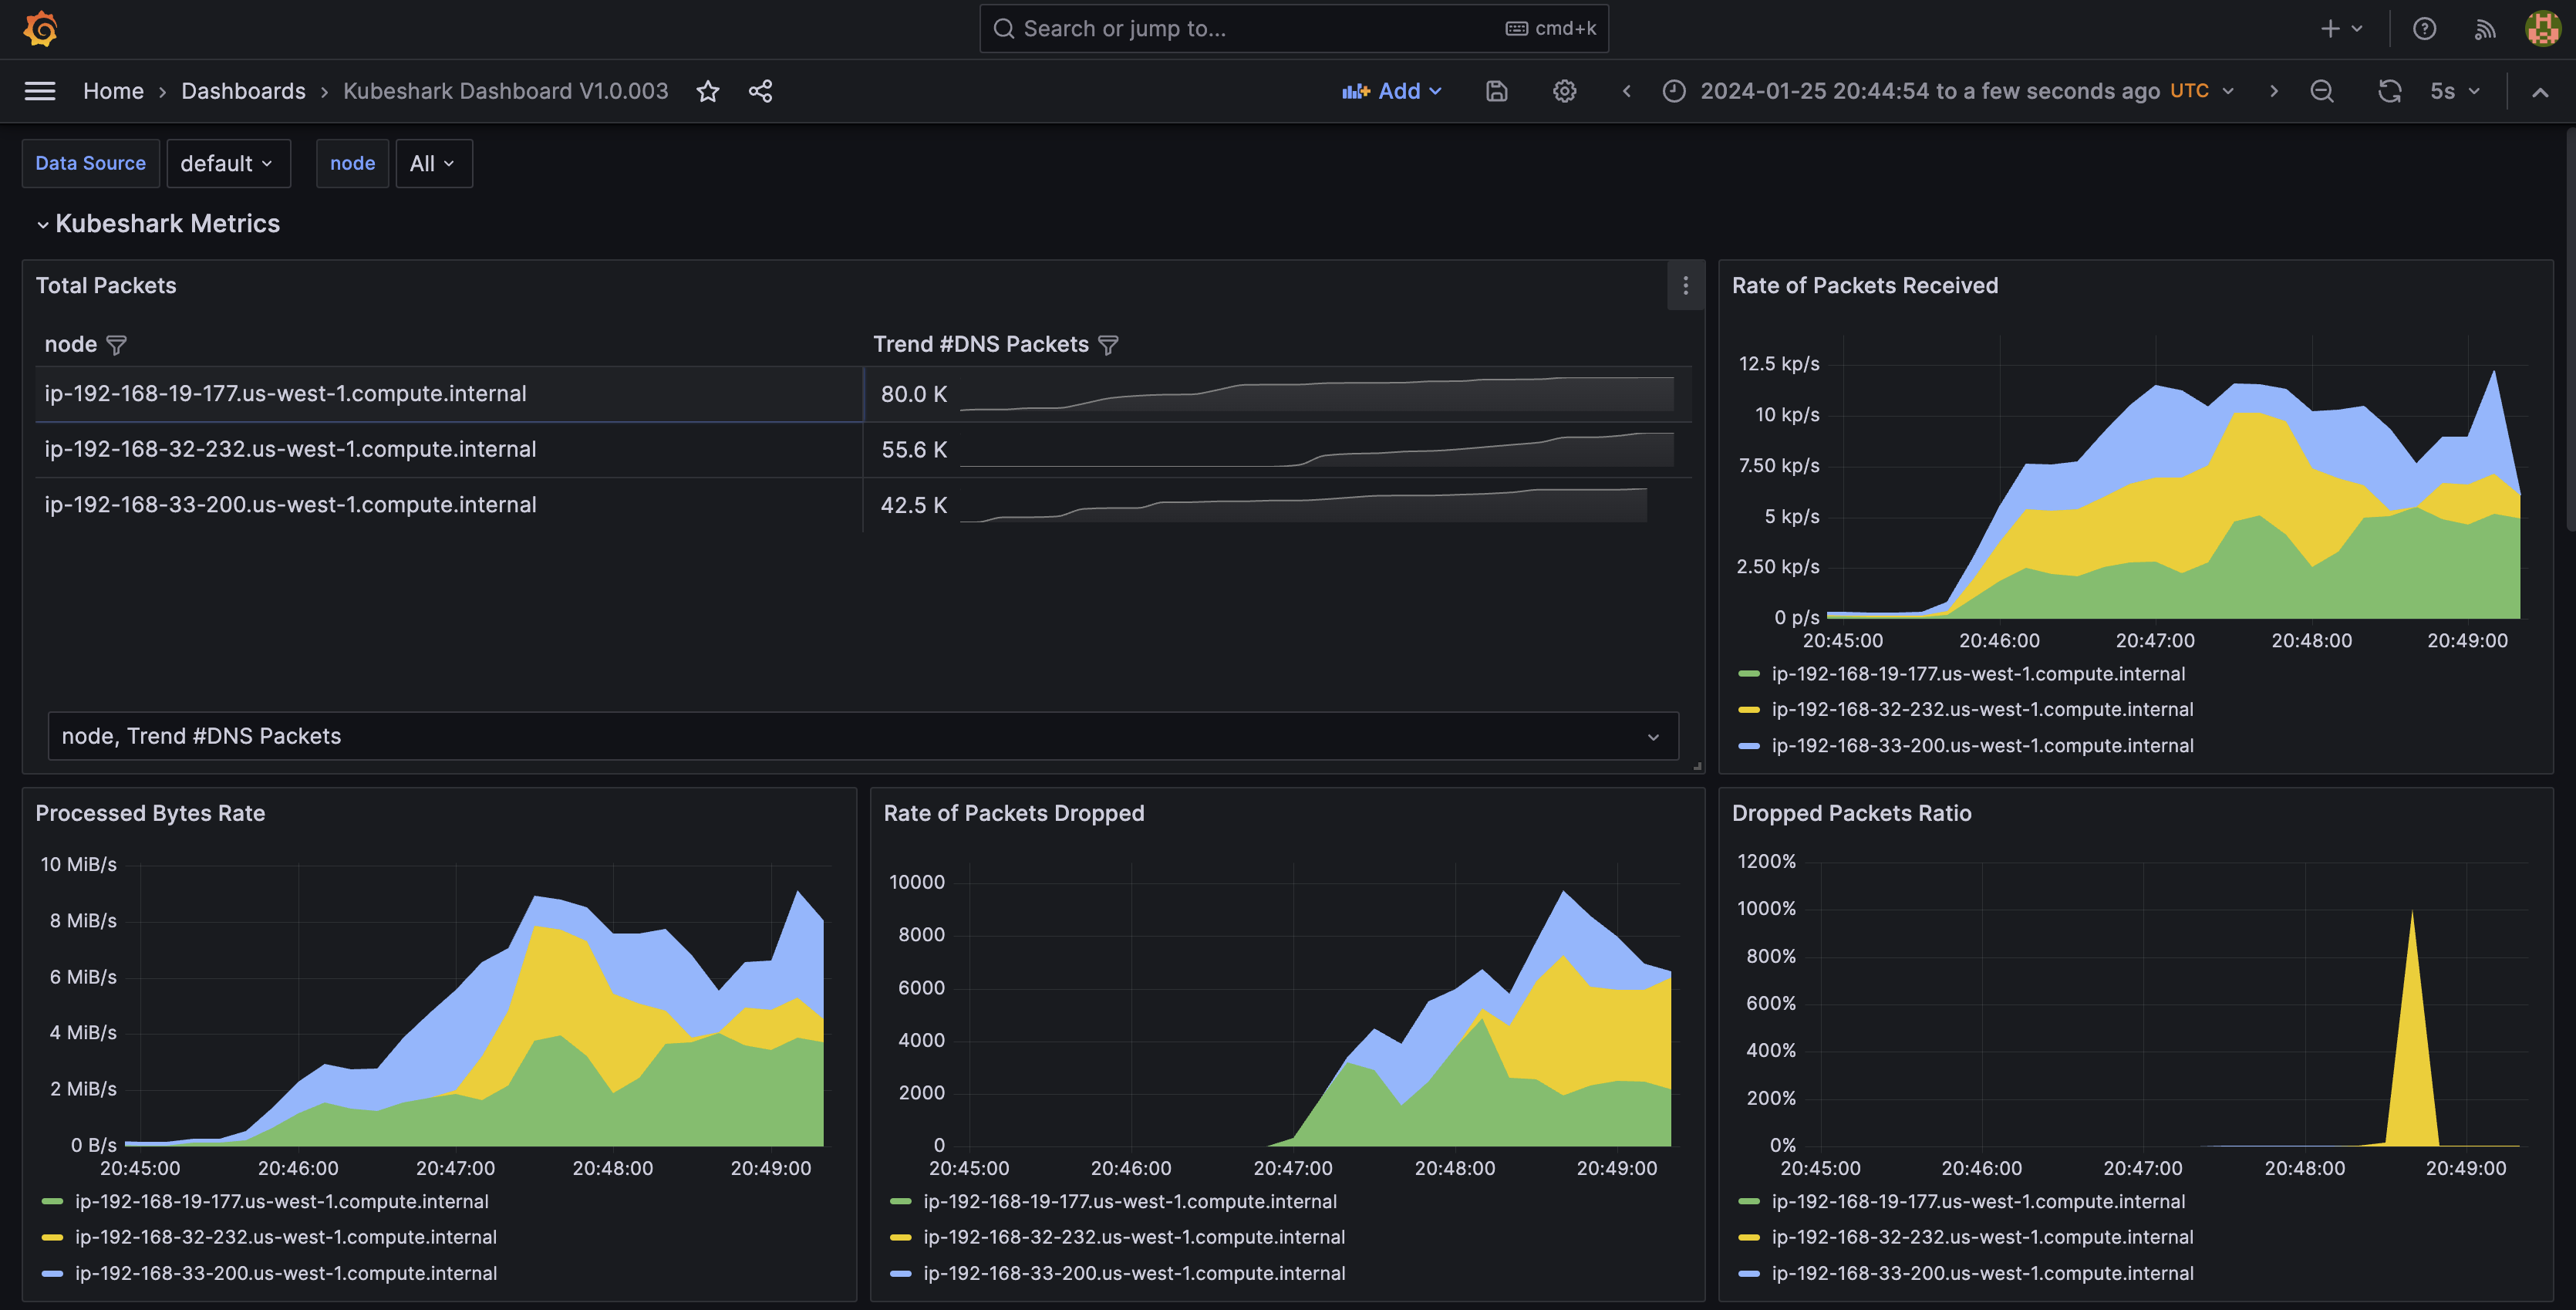
Metrics
Kubeshark provides metrics from worker components.
It can be useful for monitoring and debugging purpose.
Configuration
By default, Kubeshark uses port 49100 to expose metrics via service kubeshark-worker-metrics.
In case you use [kube-prometheus-stack] (https://github.com/prometheus-community/helm-charts/tree/main/charts/kube-prometheus-stack) community Helm chart, additional scrape configuration for Kubeshark worker metrics endpoint can be configured with values:
prometheus:
  enabled: true
  prometheusSpec:
    additionalScrapeConfigs: |
      - job_name: 'kubeshark-worker-metrics'
        kubernetes_sd_configs:
          - role: endpoints
        relabel_configs:
          - source_labels: [__meta_kubernetes_pod_name]
            target_label: pod
          - source_labels: [__meta_kubernetes_pod_node_name]
            target_label: node
          - source_labels: [__meta_kubernetes_endpoint_port_name]
            action: keep
            regex: ^metrics$
          - source_labels: [__address__, __meta_kubernetes_endpoint_port_number]
            action: replace
            regex: ([^:]+)(?::\d+)?
            replacement: $1:49100
            target_label: __address__
          - action: labelmap
            regex: __meta_kubernetes_service_label_(.+)
Available metrics
| Name | Type | Description |
|---|---|---|
| kubeshark_received_packets_total | Counter | Total number of packets received |
| kubeshark_dropped_packets_total | Counter | Total number of packets dropped |
| kubeshark_processed_bytes_total | Counter | Total number of bytes processed |
| kubeshark_tcp_packets_total | Counter | Total number of TCP packets |
| kubeshark_dns_packets_total | Counter | Total number of DNS packets |
| kubeshark_icmp_packets_total | Counter | Total number of ICMP packets |
| kubeshark_reassembled_tcp_payloads_total | Counter | Total number of reassembled TCP payloads |
| kubeshark_matched_pairs_total | Counter | Total number of matched pairs |
| kubeshark_dropped_tcp_streams_total | Counter | Total number of dropped TCP streams |
| kubeshark_live_tcp_streams | Gauge | Number of live TCP streams |
| kubeshark_tls_packet_count_total | Gauge | Total number of received TLS packets |
| kubeshark_tls_packet_dropped_total | Gauge | Total number of dropped TLS packets |
Summary
This dashboard provides a holistic view of Kubeshark resource consumption, in addition to custom metrics that offer insights into what Kubeshark is doing internally
Data source config
Collector config:
Upload an updated version of an exported dashboard.json file from Grafana
| Revision | Description | Created | |
|---|---|---|---|
| Download |