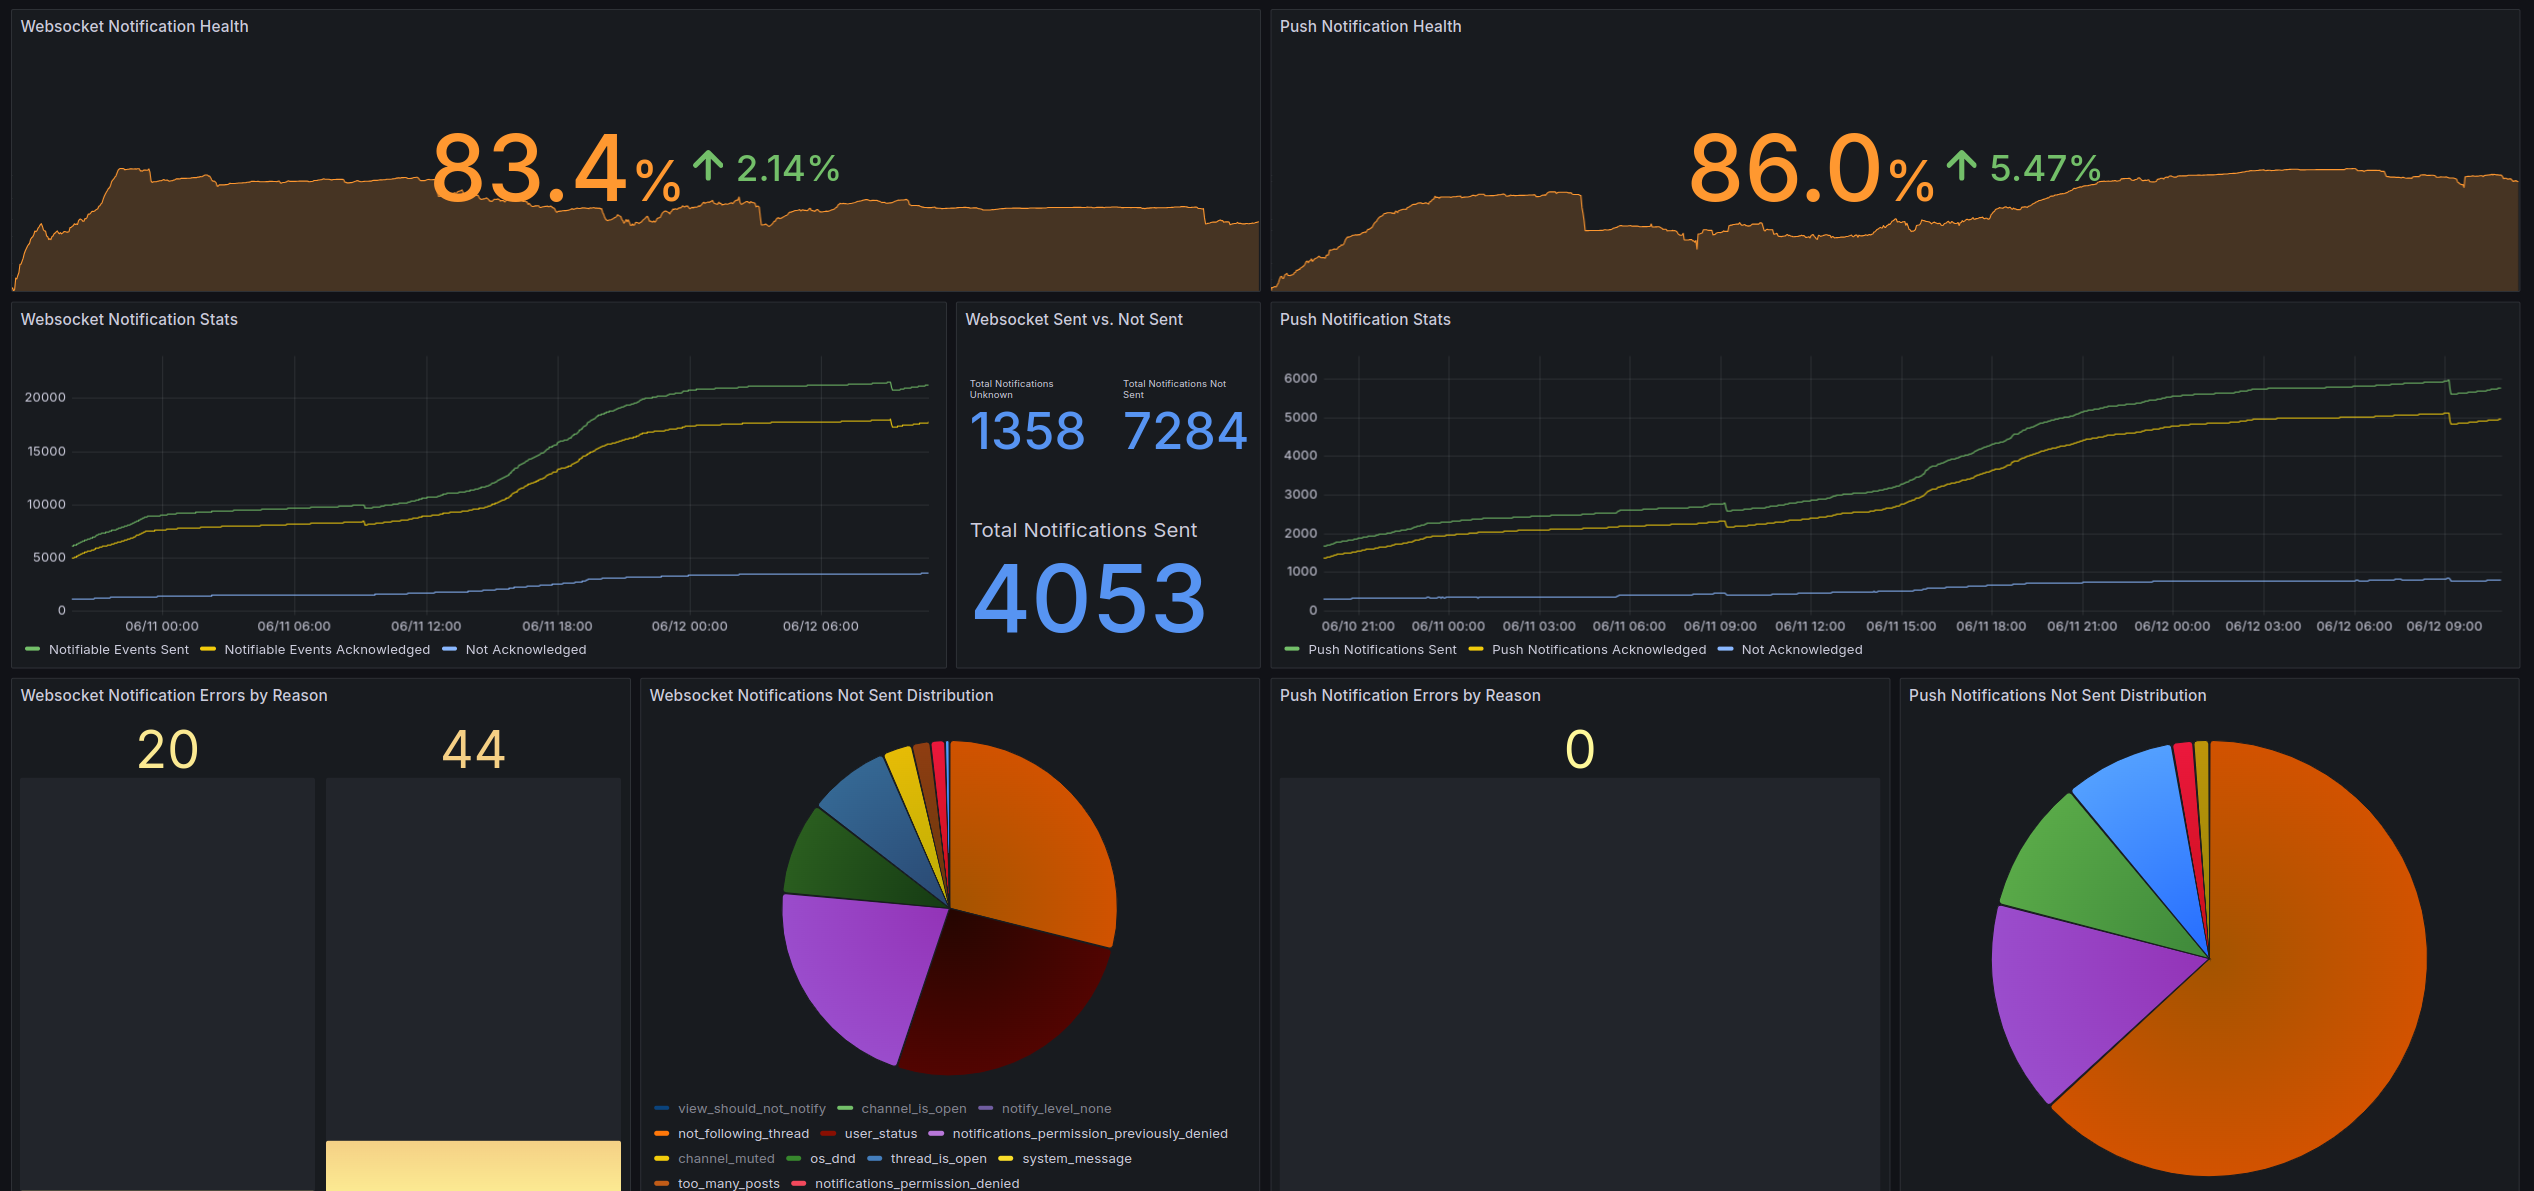
Mattermost Notification Health
A dashboard displaying notification health metrics, and distributions around notifications that were not sent, both deliberate and indeliberate. The dashboard is split in half by Websocket events (POSTED events from the server to web clients) and Push events (events sent to the push proxy to be received by mobile clients).
The Mattermost Notification Health dashboard uses the __expr__ and prometheus data sources to create a Grafana dashboard with the bargauge, piechart, stat and timeseries panels.
Data source config
Collector type:
Collector plugins:
Collector config:
Revisions
Upload an updated version of an exported dashboard.json file from Grafana
| Revision | Description | Created | |
|---|---|---|---|
| Download |