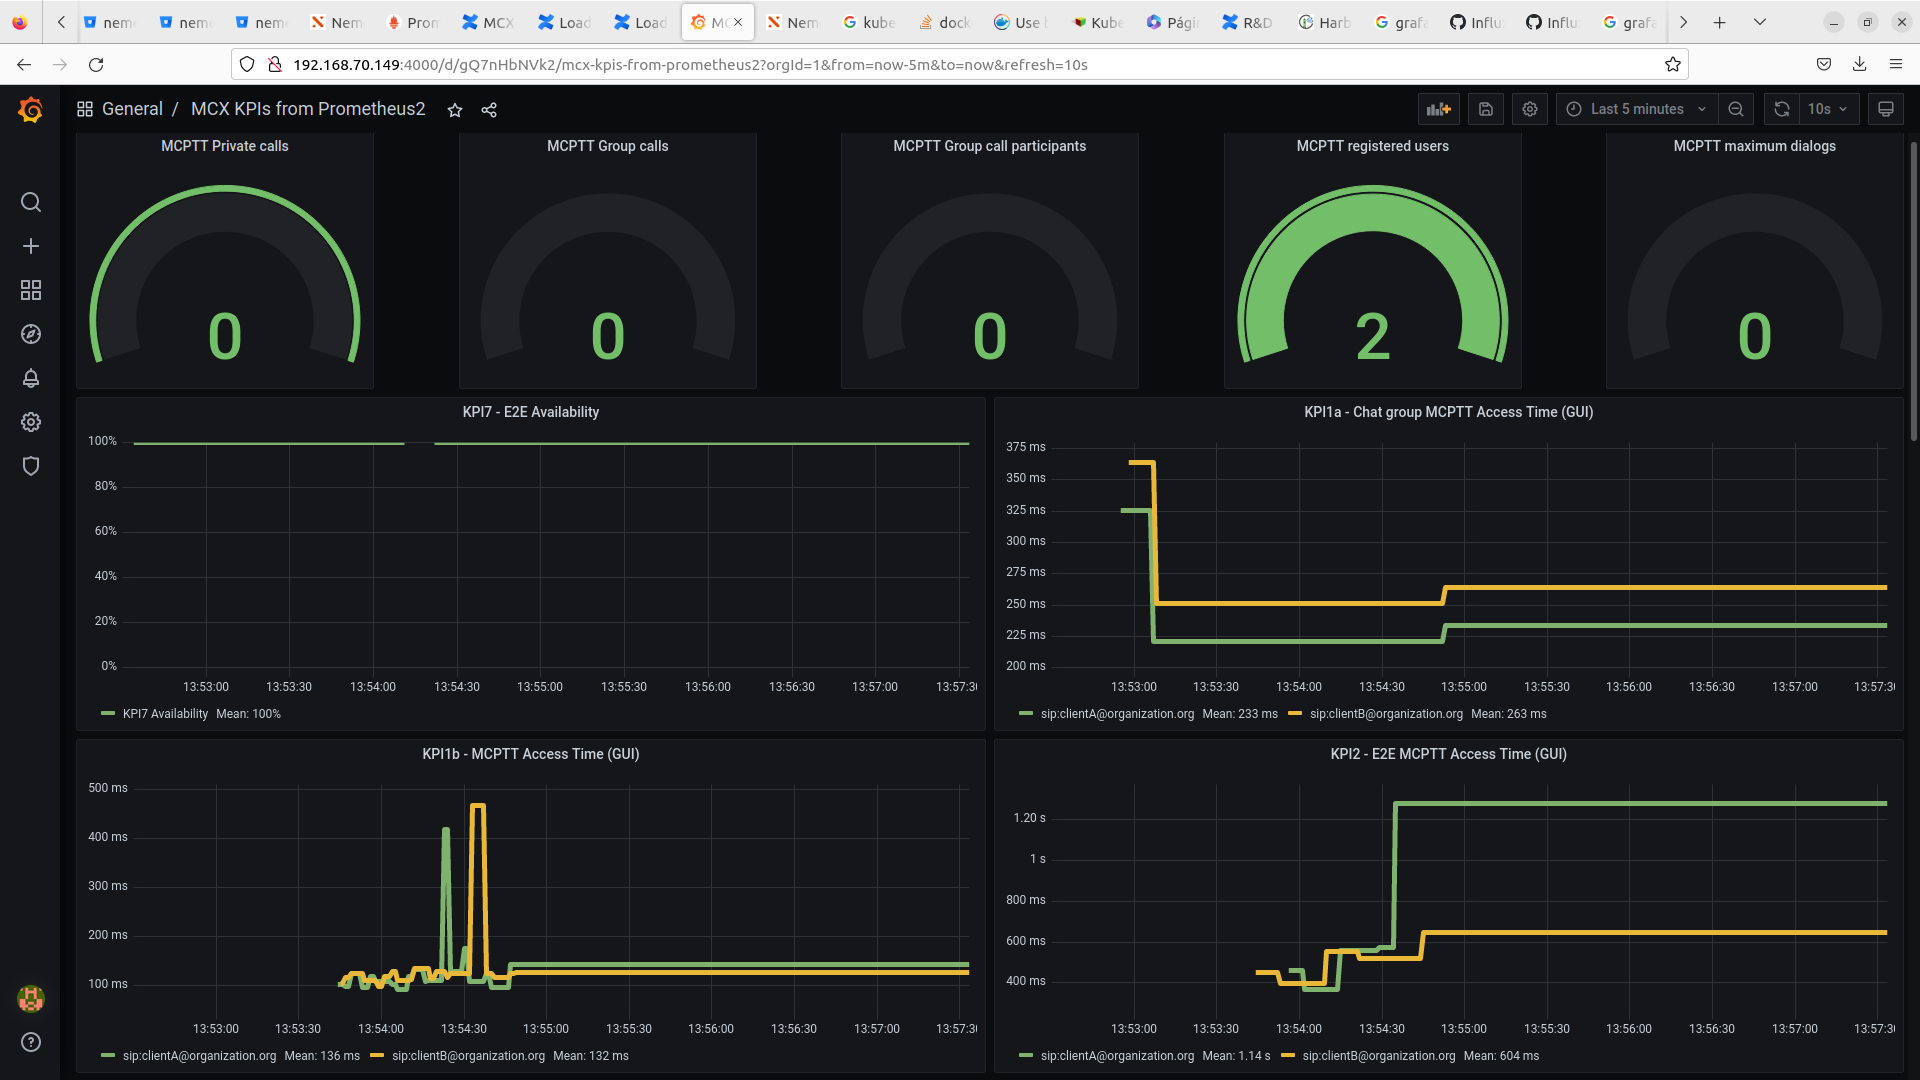
Experimentation monitoring & troubleshooting dashboard
3GPP MCX KPIs KPIs from Prometheus
Dashboard for MCX metrics and KPIs monitoring, which allows to control the general behaviour of the MCX system regarding MCPTT calls mostly. KPIs monitored follow the standard definition in 3GPP TS 22.179 Mission Critical Push to Talk (MCPTT); Stage 1.
Among the MCX KPIs monitored the following can be founds: i) KPI1 MCPTT Access time (KPI1a and KPI1b); ii) KPI2 End-to-end MCPTT Access time; iii) KPI3 Mouth-to-ear latency; iv) KPI4 Late call entry time; and v) KPI7 MCPTT End-to-End Availability. KPIs 1, 2, and 3 are each one measured at multiple different stages of the procedure to deliver a finer level of detail in their monitorization. Some other extra metrics included are: i) Current MCPTT Private calls; ii) Current MCPTT Group calls; iii) Current MCPTT Group call participants; iv) Current MCPTT registered users; v) Current MCPTT maximum dialogs; vi) SIP registration time; vii) Multicall monitoring time; viii) Network change time; ix) Instantiation time; and x) Talk group merging time.
Data source config
Collector config:
Upload an updated version of an exported dashboard.json file from Grafana
| Revision | Description | Created | |
|---|---|---|---|
| Download |

