
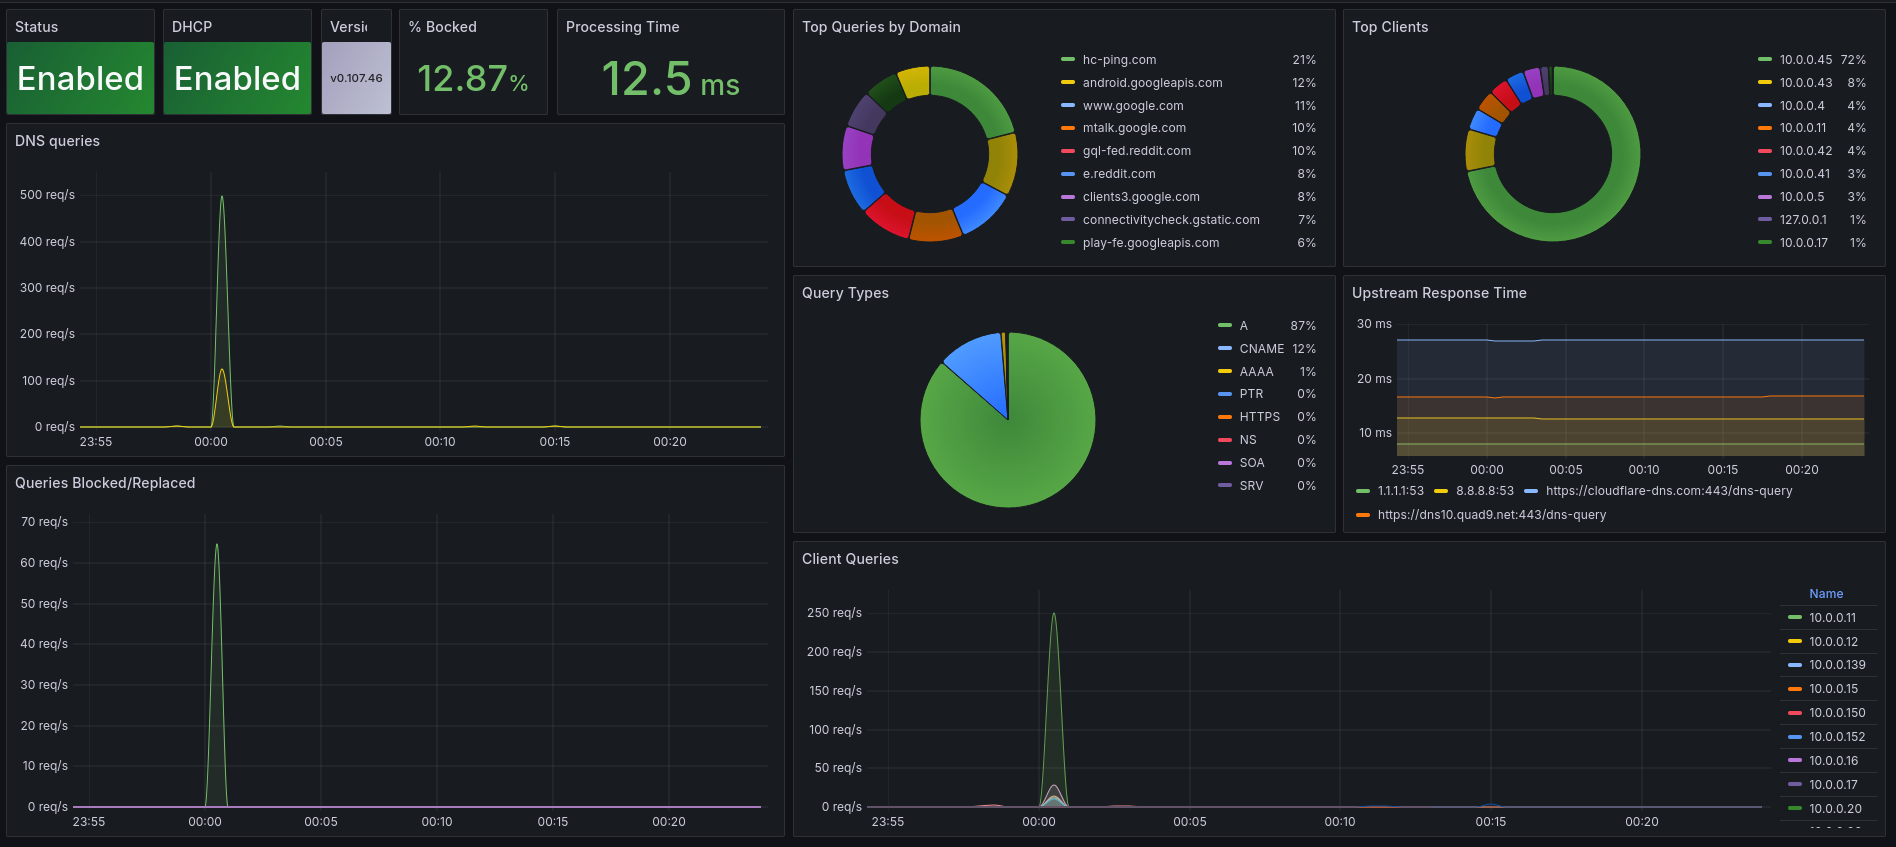
AdGuard Home Exporter
This is a AdGuard Home dashboard when using the https://github.com/henrywhitaker3/adguard-exporter Prometheus exporter
AdGuard Home Prometheus Exporter
This is a Prometheus exporter for AdGuard Home
Installation
Using Docker
You can run it using the following example and pass configuration environment variables:
$ docker run \
  -e 'ADGUARD_SERVERS=192.168.1.2' \
  -e 'ADGUARD_USERNAMES=demo' \
  -e 'ADGUARD_PASSWORDS=mypassword' \
  -e 'INTERVAL=15s' \ # Optional, defaults to 30s
  -p 9618:9618 \
  ghcr.io/henrywhitaker3/adguard-exporter:latest
A single instance of adguard-exporter can monitor multiple AdGuard Home instances. To do so, you can specify a list of servers, usernames and passwords by separating them with commas in their respective environment variable:
$ docker run \
  -e 'ADGUARD_SERVERS=192.168.1.2,192.168.1.3,192.168.1.4"' \
  -e "ADGUARD_USERNAMES=$USERNAME1,$USERNAME2,$USERNAME3" \
  -e "ADGUARD_PASSWORDS=$PASSWORD1,$PASSWORD2,$PASSWORD3" \
  -p 9618:9618 \
  ghcr.io/henrywhitaker3/adguard-exporter:latest
Usage
Once the exporter is running, you also have to update your prometheus.yml configuration to let it scrape the exporter:
scrape_configs:
  - job_name: 'adguard'
    static_configs:
      - targets: ['localhost:9618']
Available Prometheus metrics
| Metric name | Description |
|---|---|
| adguard_scrape_errors_total | The number of errors scraping a target |
| adguard_protection_enabled | Whether DNS filtering is enabled |
| adguard_running | Whether adguard is running or not |
| adguard_queries | Total queries processed in the last 24 hours |
| adguard_blocked_filtered | Total queries that have been blocked from filter lists |
| adguard_blocked_safesearch | Total queries that have been blocked due to safesearch |
| adguard_blocked_safebrowsing | Total queries that have been blocked due to safebrowsing |
| adguard_avg_processing_time_seconds | The average query processing time in seconds |
| adguard_top_queried_domains | The number of queries for the top domains |
| adguard_top_blocked_domains | The number of blocked queries for the top domains |
| adguard_top_clients | The number of queries for the top clients |
| adguard_top_upstreams | The number of repsonses for the top upstream servers |
| adguard_top_upstreams_avg_response_time_seconds | The average response time for each of the top upstream servers |
| adguard_dhcp_enabled | Whether dhcp is enabled |
| adguard_dhcp_leases | The dhcp leases |
Data source config
Collector config:
Upload an updated version of an exported dashboard.json file from Grafana
| Revision | Description | Created | |
|---|---|---|---|
| Download |
Home Assistant
Easily monitor Home Assistant, an open source software platform designed for home automation, with Grafana Cloud's out-of-the-box monitoring solution.
Learn more