
Mithril signer
Mithril signer metrics dashboard
Welcome to the Mithril signer dashboard for Grafana!
With this dashboard you can leverage the Prometheus endpoint of your Mithril signer node to visualize its key metrics.
In order to activate the metrics endpoint of your node, please refer to this guide: https://mithril.network/doc/manual/getting-started/run-signer-node/#activate-prometheus-endpoint
Then configure the scraping of the metrics in a job name mithril-signers, add as many targets as you need in /etc/prometheus/prometheus.yml. Here is an example configuration:
  - job_name: 'mithril-signers'
    static_configs:
      - targets: ['localhost:9090']
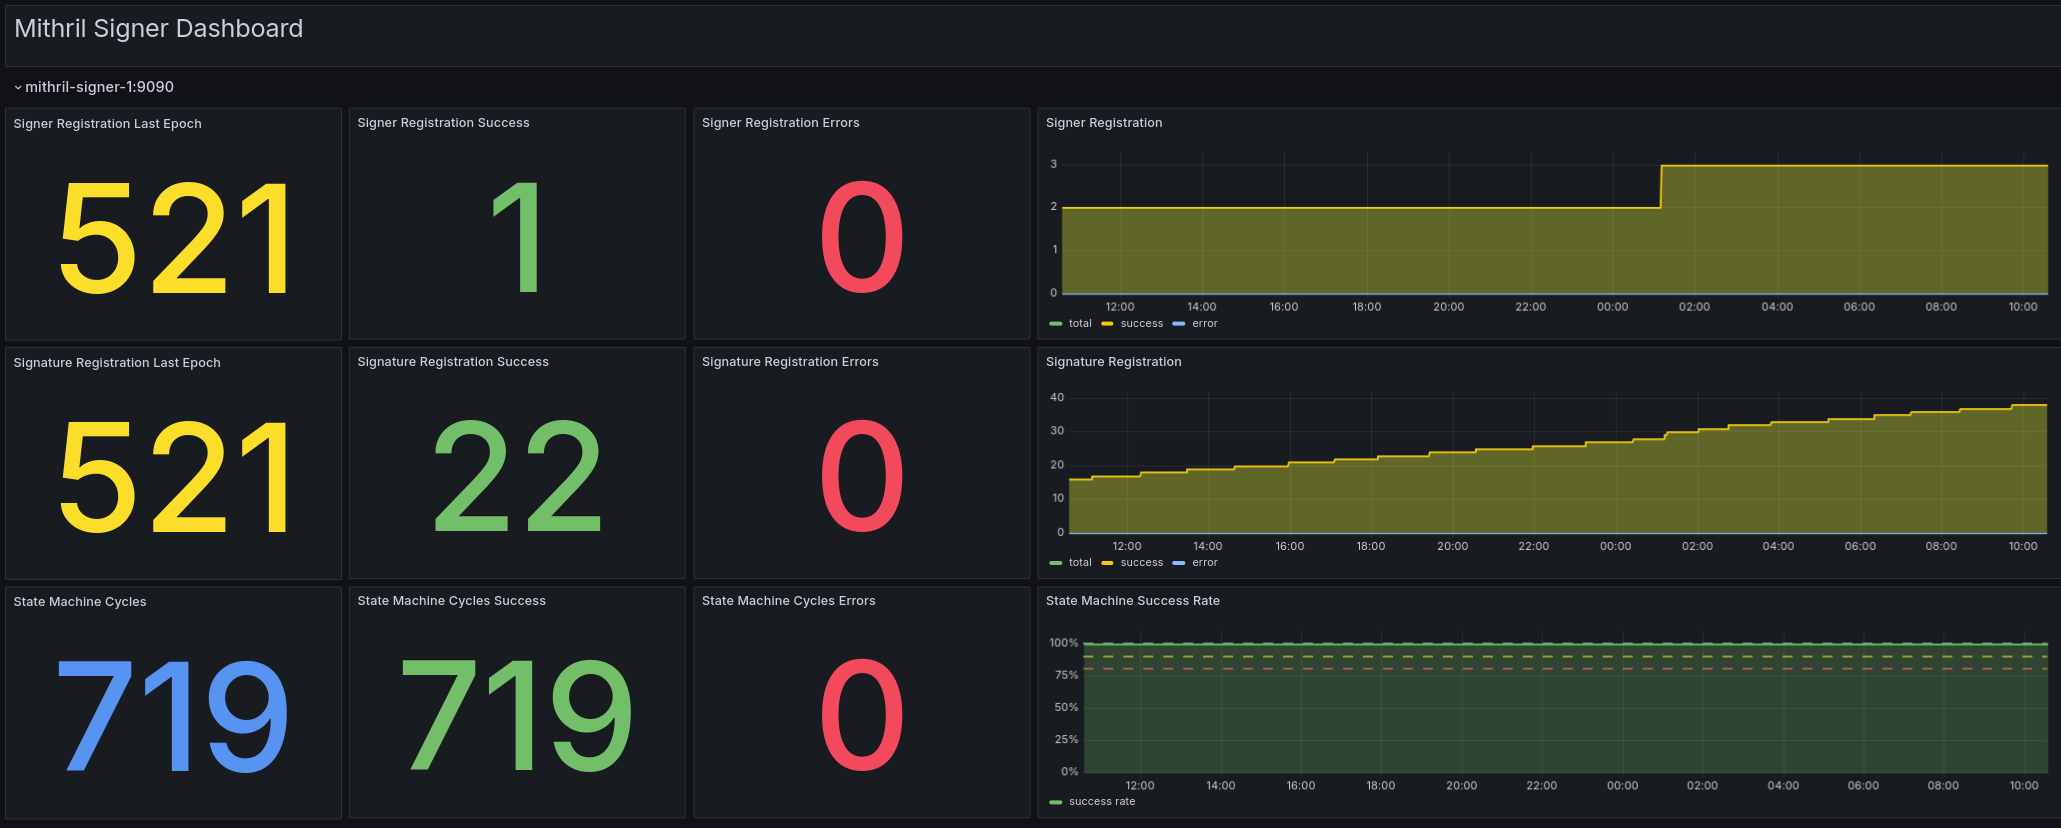
Here is a list of the metrics provided by the Mithril dashboard which will help better monitoring of the Mithril signer node:
| Metrics | Description |
|---|---|
| Signer Registration Last Epoch | The epoch during which the last signer registration occurred. |
| Signer Registration Success | Number of successful signer registrations for the selected period. |
| Signer Registration Errors | Number of errors that occurred during signer registrations for the selected period. |
| Signature Registration Last Epoch | The epoch during which the last signature registration occurred. |
| Signature Registration Success | Number of successful signature registrations for the selected period. |
| Signature Registration Errors | Number of errors that occurred during signature registrations for the selected period. |
| State Machine Cycles | Total number of state machine cycles for the selected period. |
| State Machine Cycles Success | Number of state machine cycles that ended successfully for the selected period. |
| State Machine Cycles Errors | Number of state machine cycles that ended due to an error for the selected period. |
We also recommend to investigate and escalate:
- any error on the Signer Registration.
- any error on the Signature Registration.
- any error rate exceeding 1% on the State Machine Cycles.
Learn more about Mithril at https://mithril.network
Feel free to reach out to us on the Discord channel for questions and/or help.
Data source config
Collector config:
Upload an updated version of an exported dashboard.json file from Grafana
| Revision | Description | Created | |
|---|---|---|---|
| Download |