Angie
Grafana dashboard for Angie (fork of nginx) web server metrics
Understand Angie web server's metrics.
Setup
- Using the the http_prometheus module, add the following changes to the http block of the configuration file:
http {
include prometheus_all.conf;

...

    location =/p8s {
        prometheus all;
    }
}
- Add the following configuration to Prometheus:
scrape_configs:
  - job_name: "angie"
    scrape_interval: 15s
    metrics_path: “/p8s”
    static_configs:
      - targets: ["angie:80"]
It collects metrics from the specified target, angie:80, every 15 seconds, utilizing the /p8s configured at the previous step.
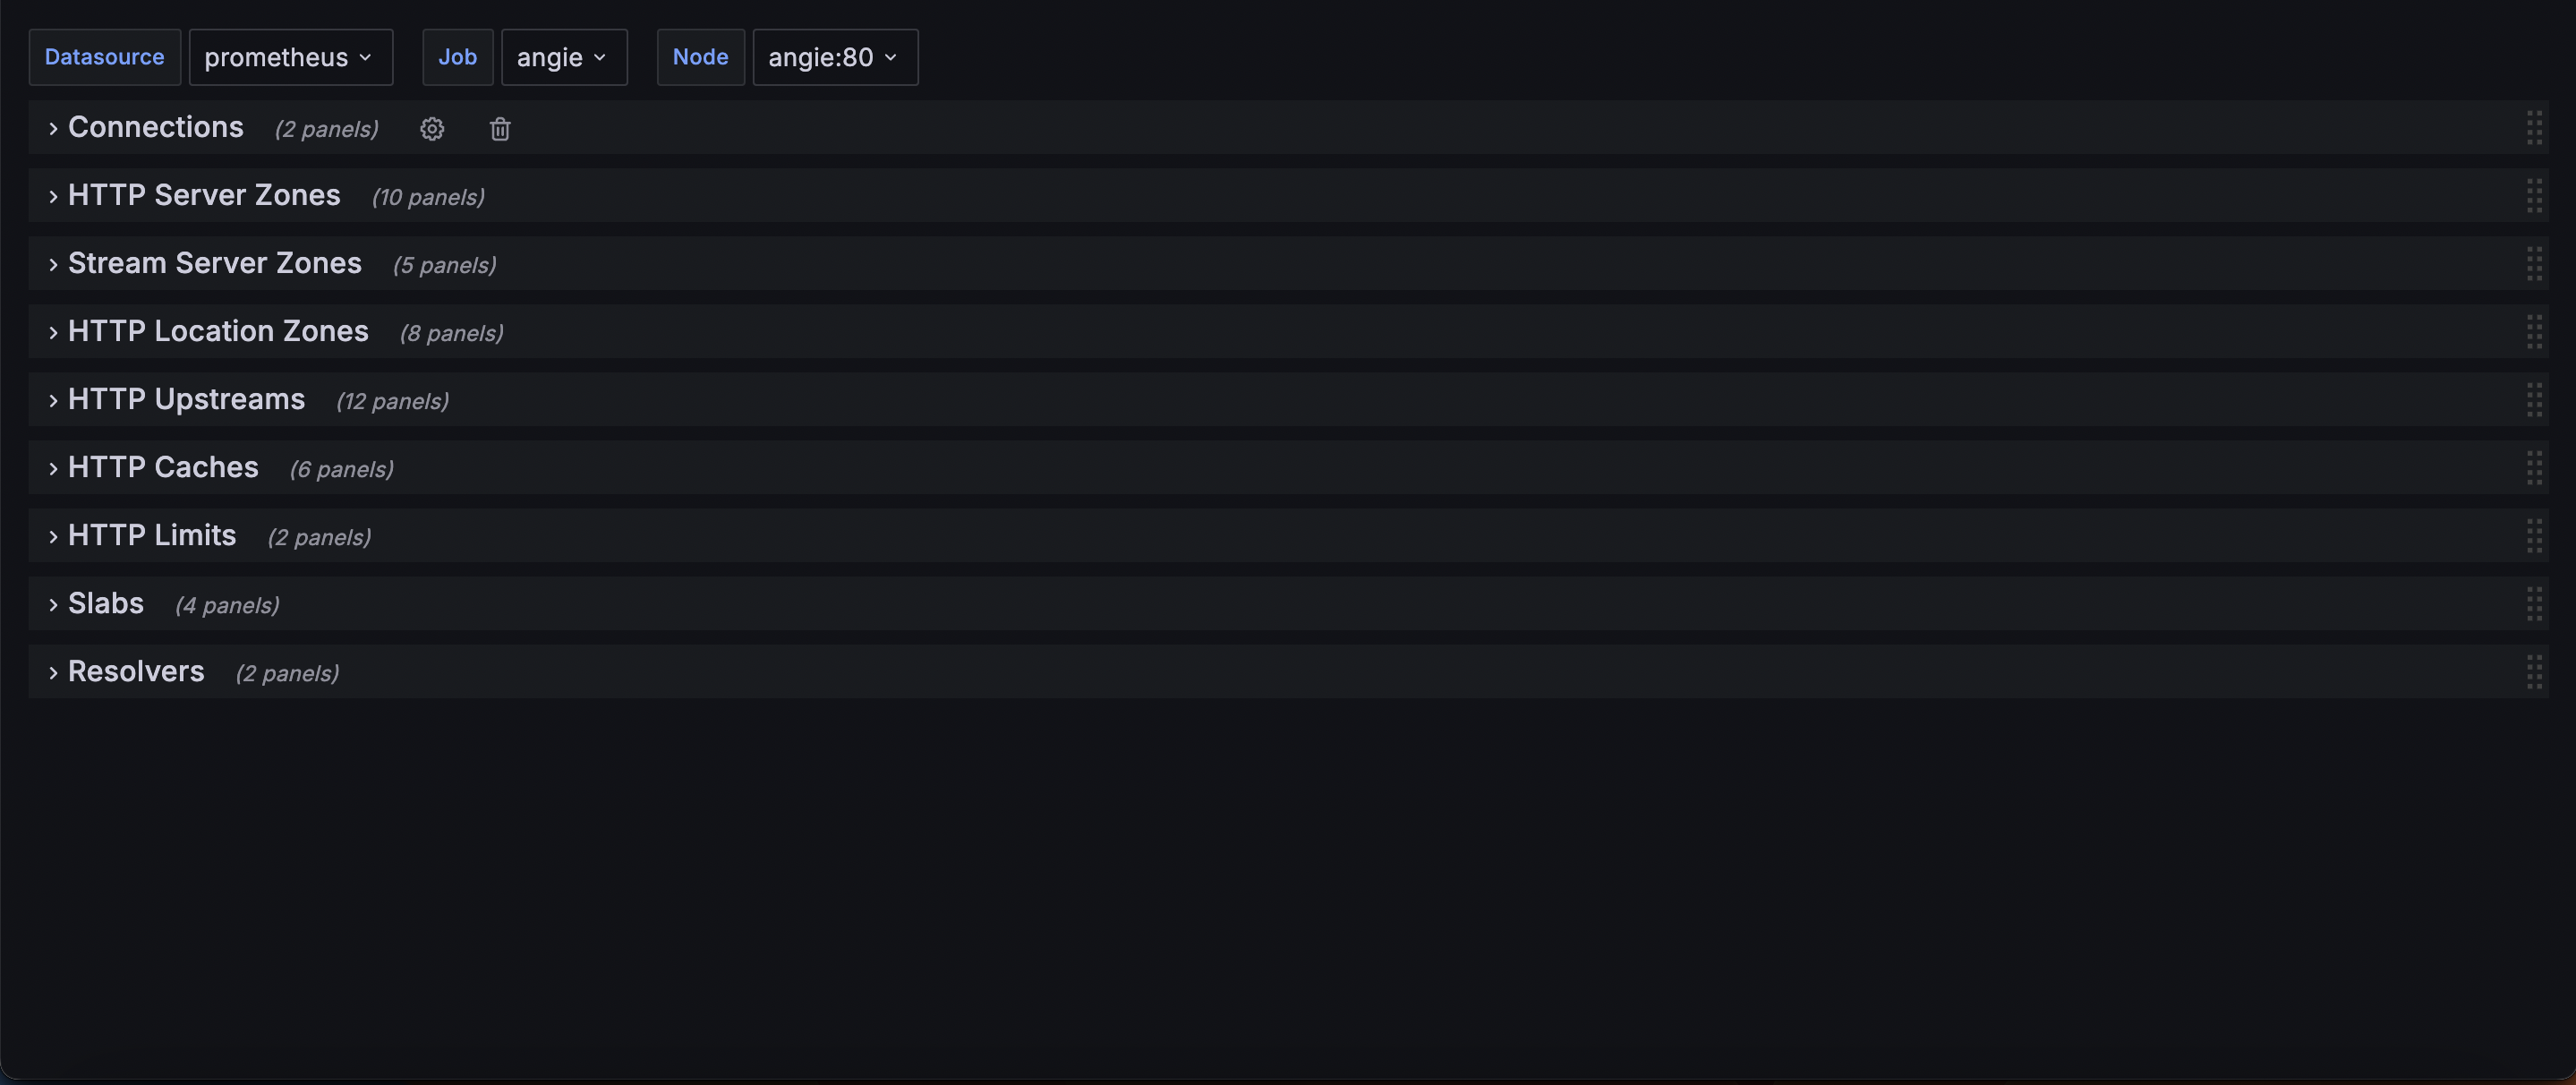
Metrics Monitored
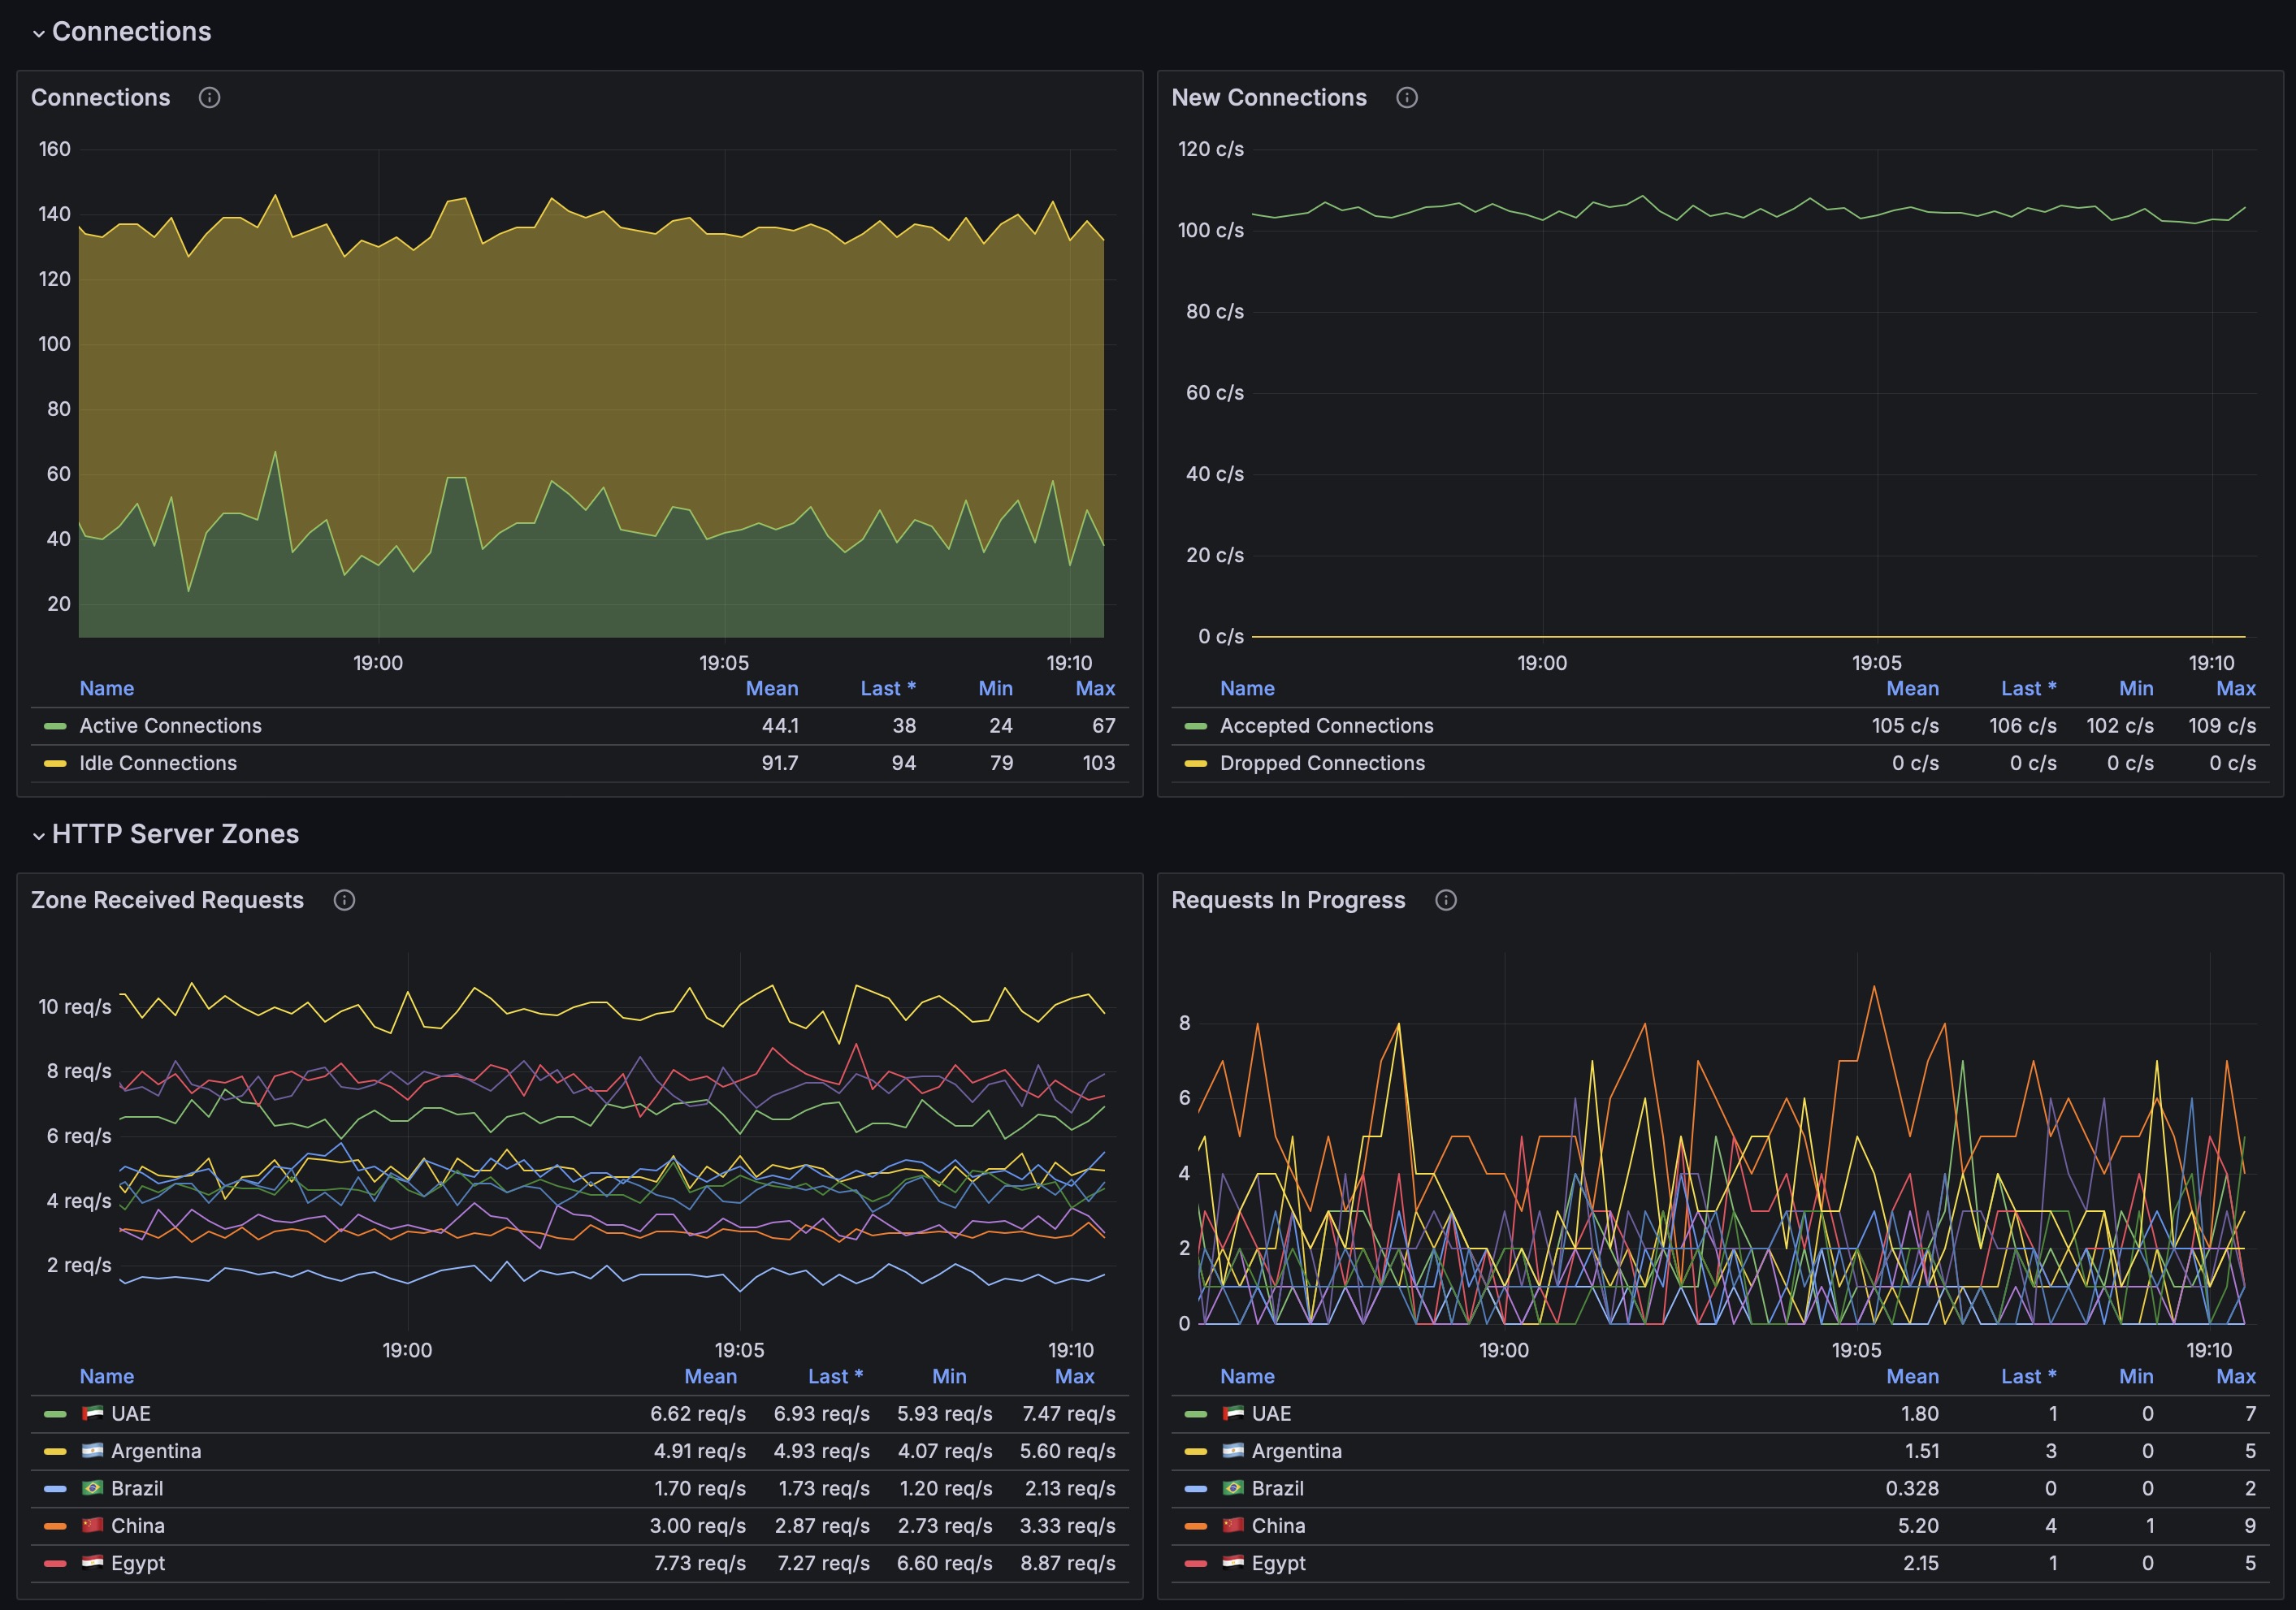
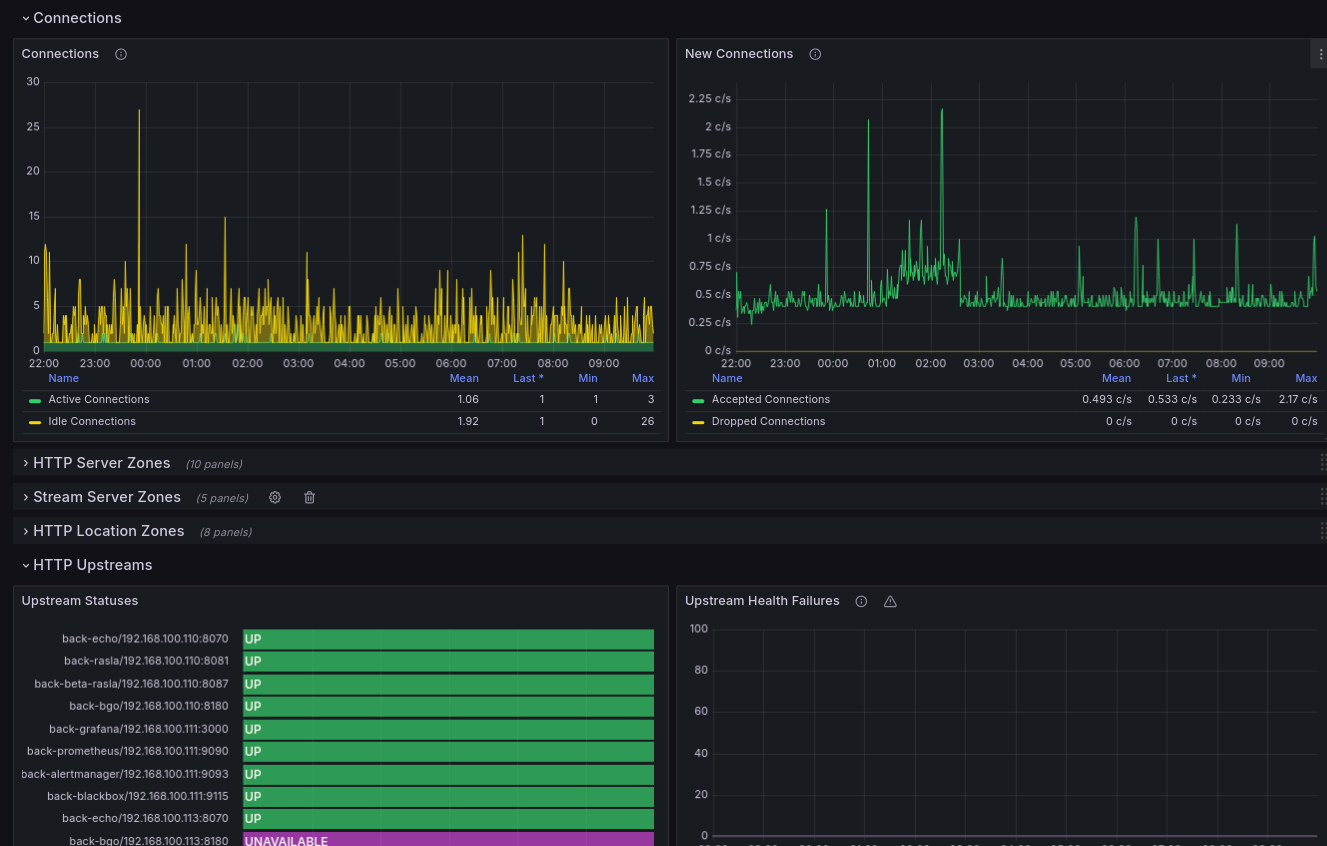
- Connections: Active/Idle, Accepted/Dropped Connections
- Total HTTP Request Rate (per server zone/location zone/upstream)
- HTTP Requests in Progress (per server zone/location zone/upstream)
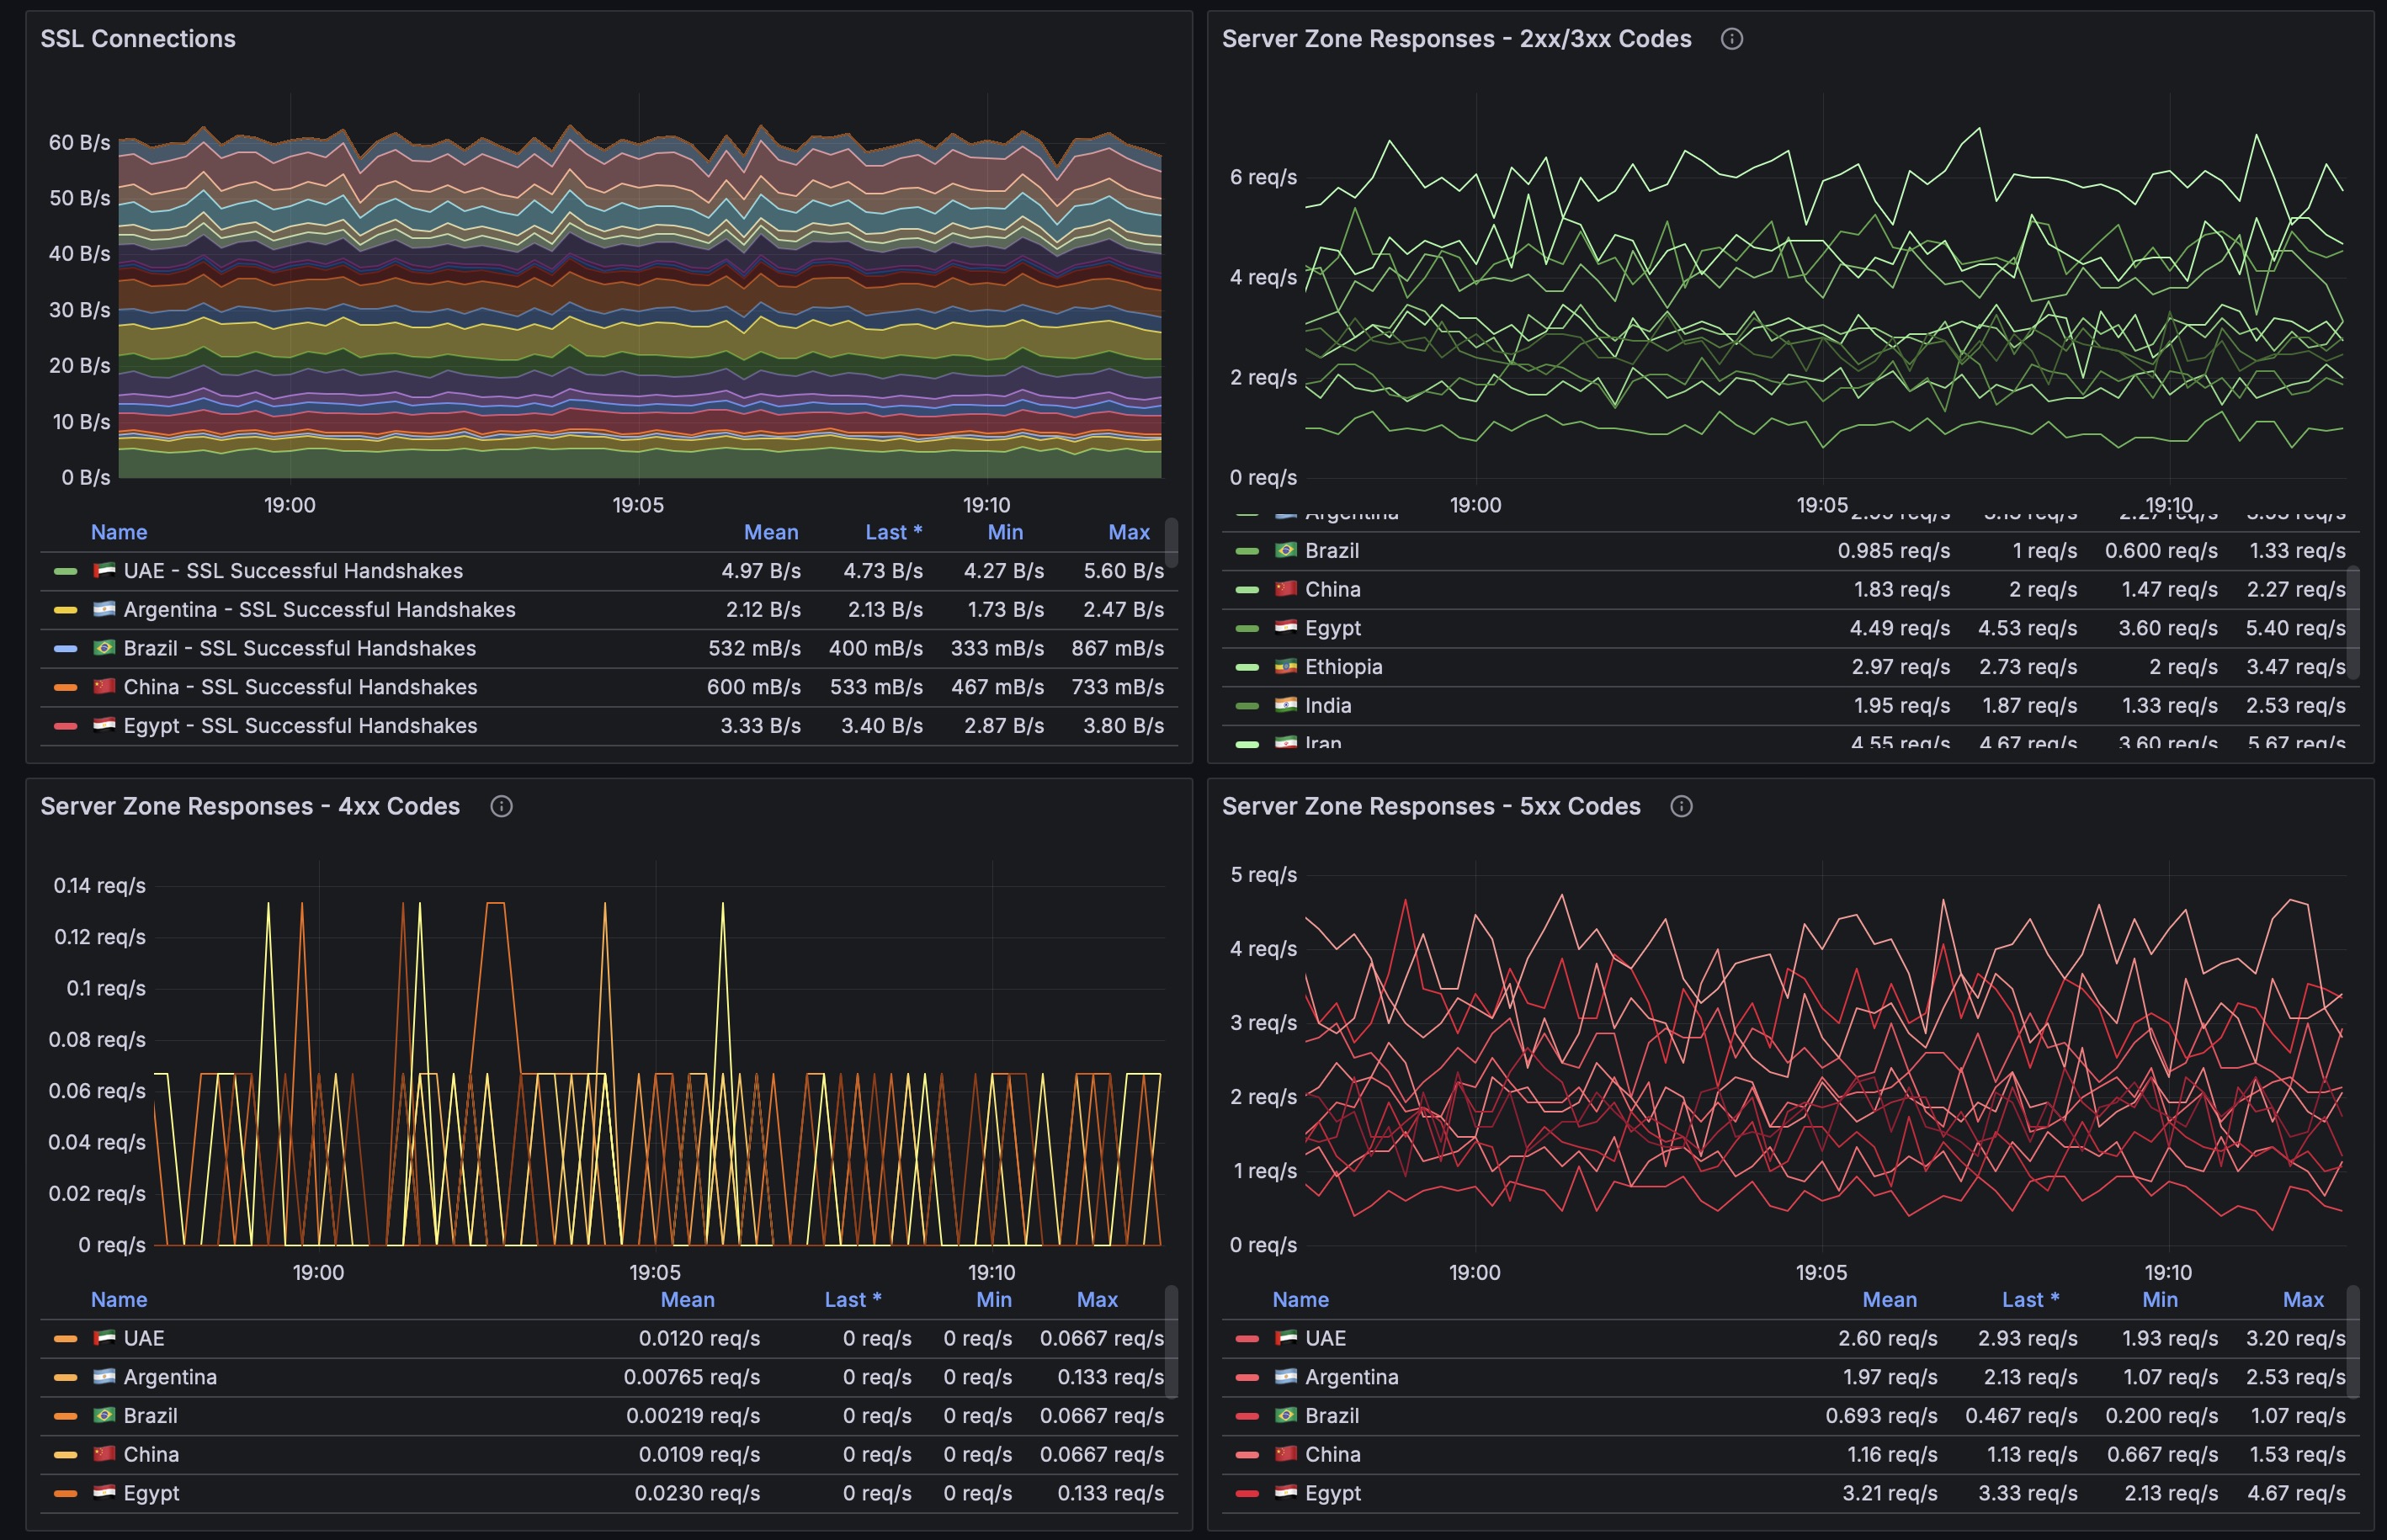
- HTTP Bandwidth (per server zone/location zone/upstream)
- 200-300 HTTP Response Code Rate (per server zone/location zone/upstream)
- 4xx HTTP Response Code Rate (per server zone/location zone/upstream)
- 5xx HTTP Response Code Rate (per server zone/location zone/upstream)
- HTTP Cache Size
- HTTP Cache Request Stats
- HTTP limit_conn and limit_req Stats
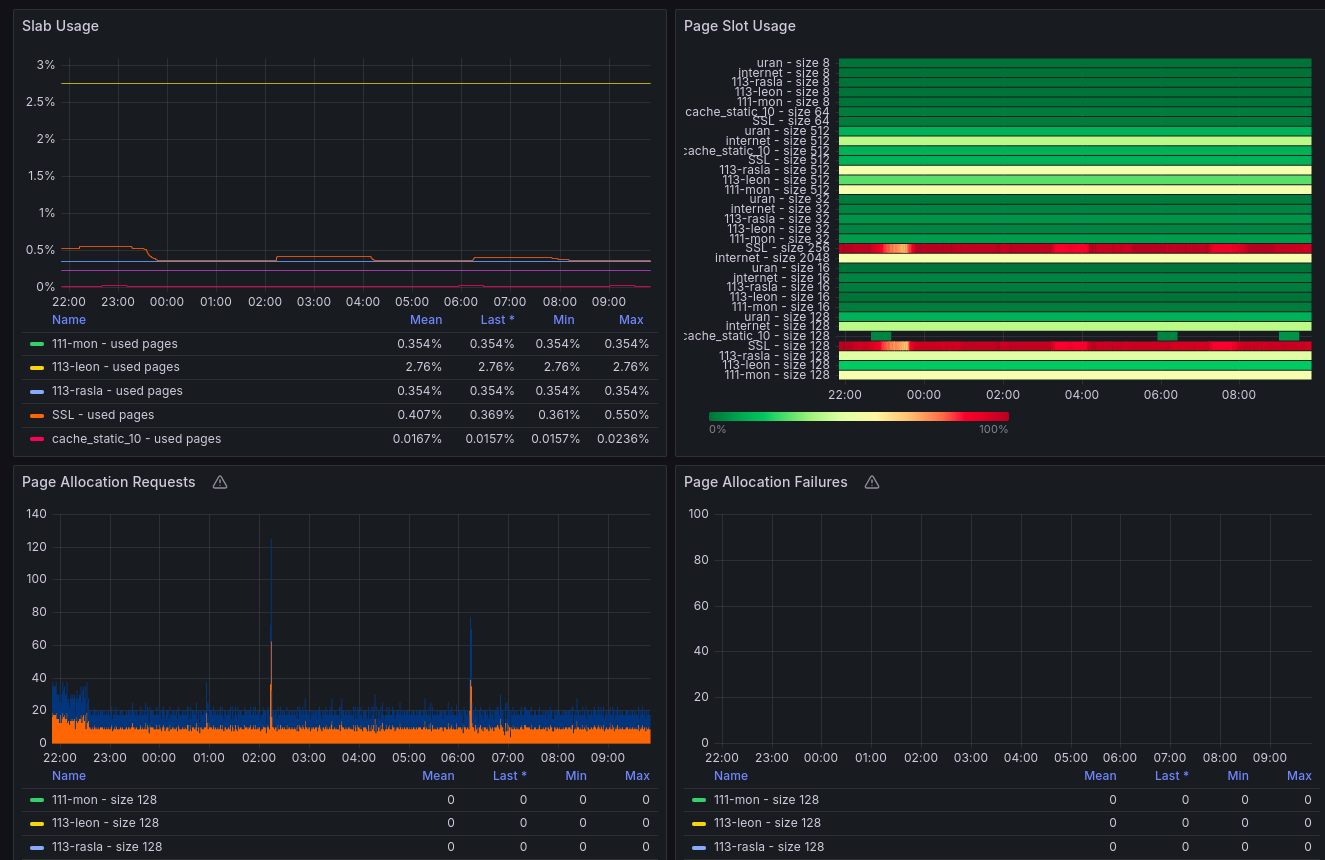
- Slabs usage and allocation Stats
- Resolver stats
- SSL stats
Data source config
Collector type:
Collector plugins:
Collector config:
Revisions
Upload an updated version of an exported dashboard.json file from Grafana
| Revision | Description | Created | |
|---|---|---|---|
| Download |