KrakenD - OpenTelemetry + Prometheus
RECOMMENDED INSTALL. KrakenD dashboard based on Prometheus integration via OpenTelemetry
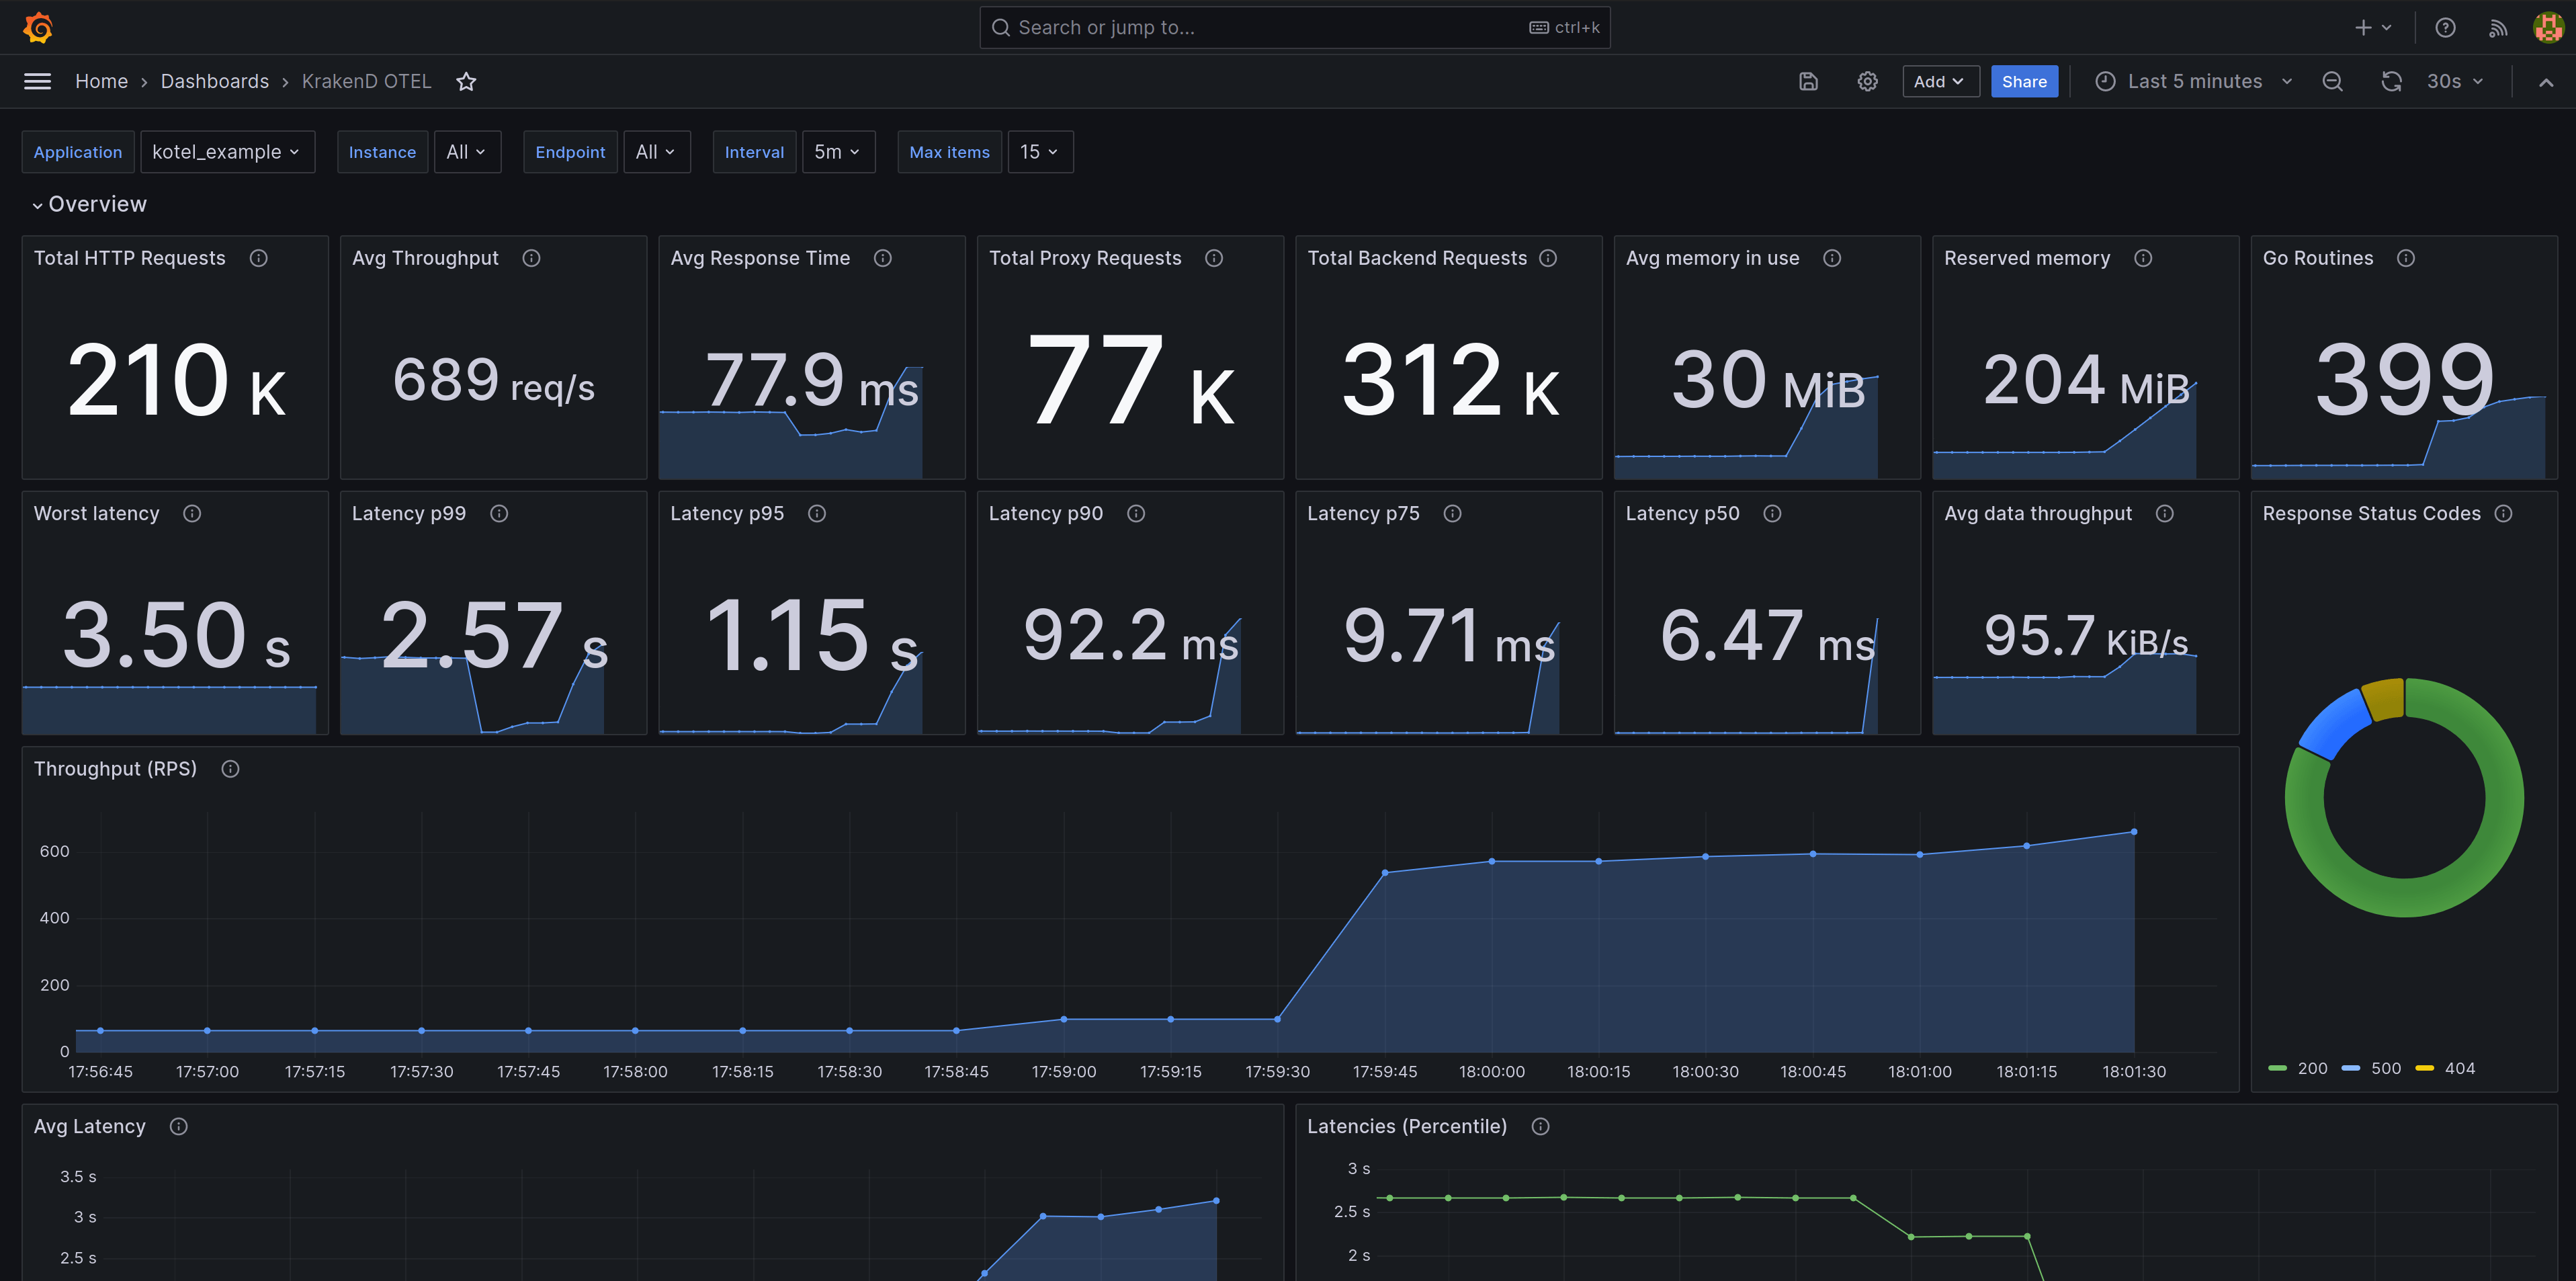
The preconfigured Grafana dashboard for KrakenD offers valuable information to understand the performance of your services and detect anomalies in the service.
The dashboard is extensive and offers you metrics like:
- Requests from users to KrakenD
- Requests from KrakenD to your backends
- Response times
- Memory usage and details
- Endpoints and status codes
- Latencies
- Heatmaps
- Open connections
- Throughput
- Distributions, timers, garbage collection and a long etcetera
Resources:
Data source config
Collector type:
Collector plugins:
Collector config:
Revisions
Upload an updated version of an exported dashboard.json file from Grafana
| Revision | Description | Created | |
|---|---|---|---|
| Download |
Metrics Endpoint (Prometheus)
Easily monitor any Prometheus-compatible and publicly accessible metrics URL with Grafana Cloud's out-of-the-box monitoring solution.
Learn more