
air-Q Prometheus Exporter
This Dashboard is made for https://github.com/Wandmalfarbe/airq-prometheus-exporter.
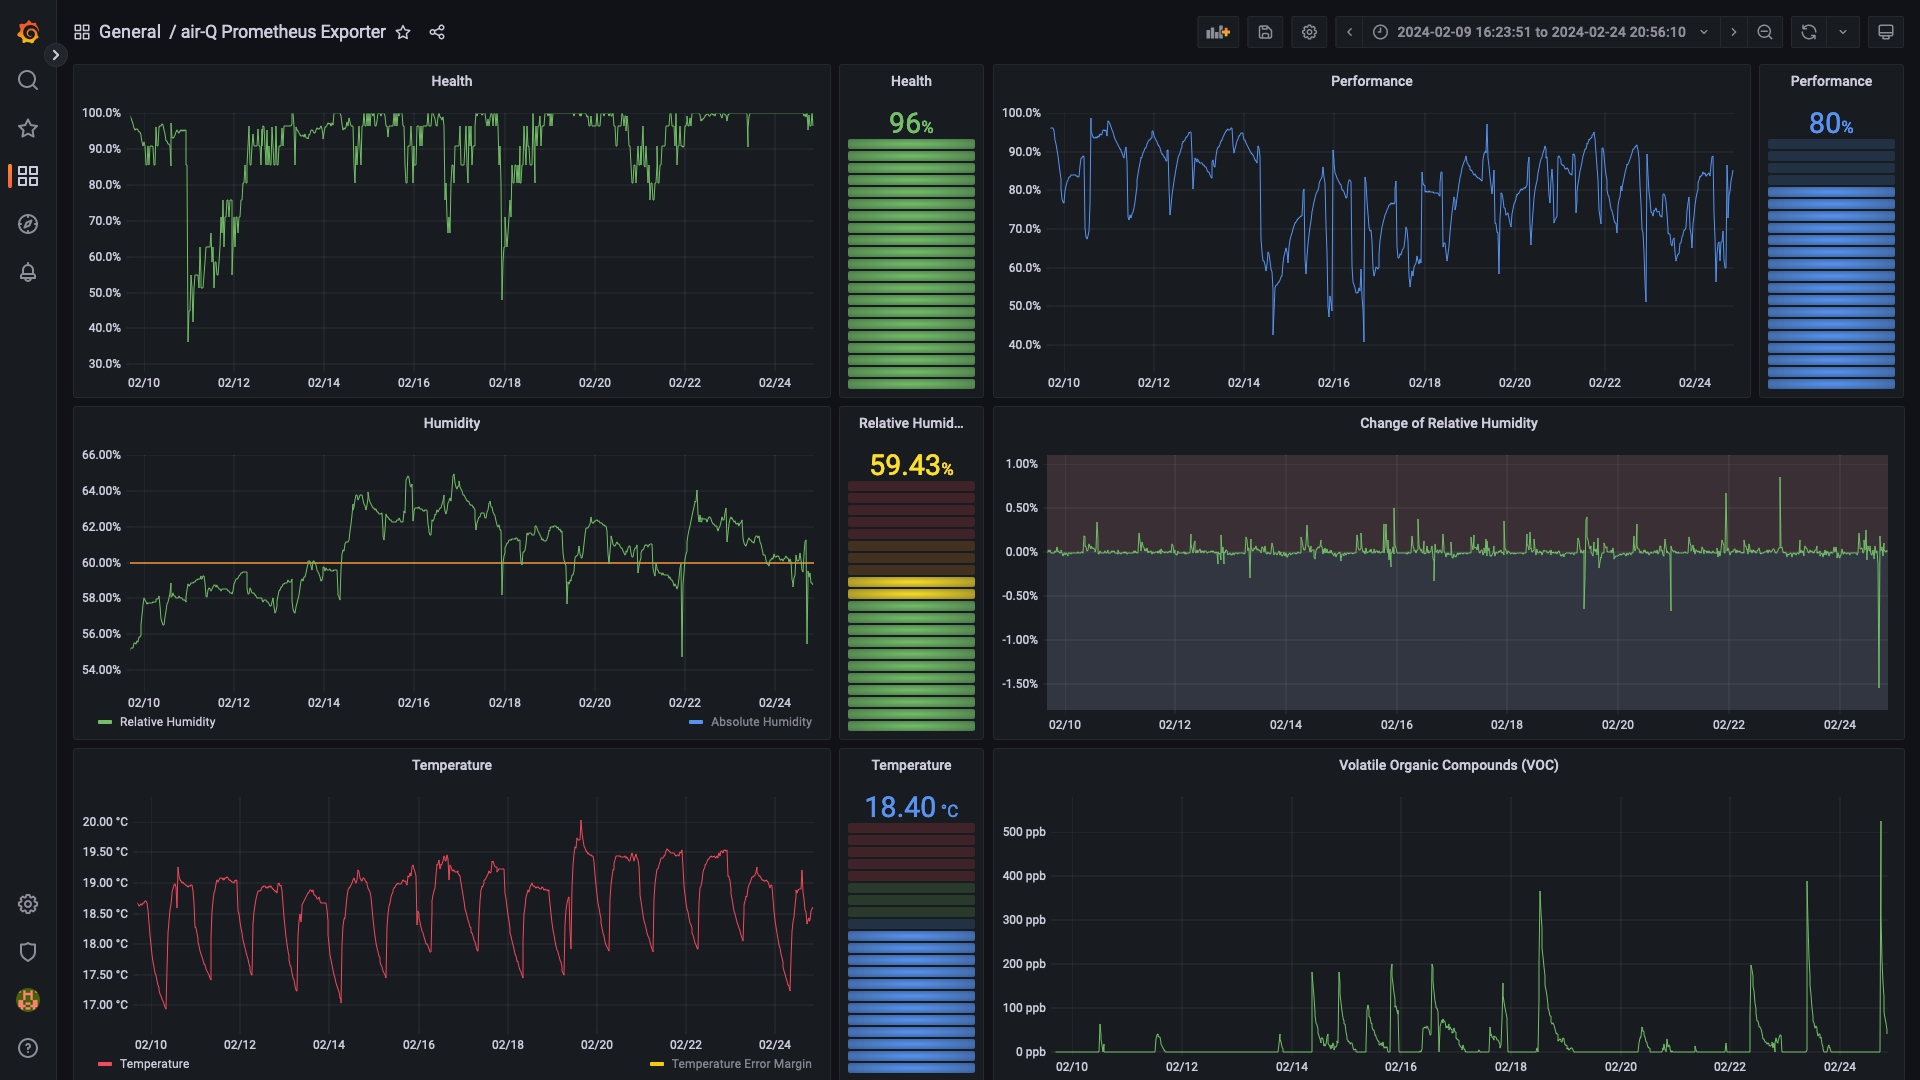
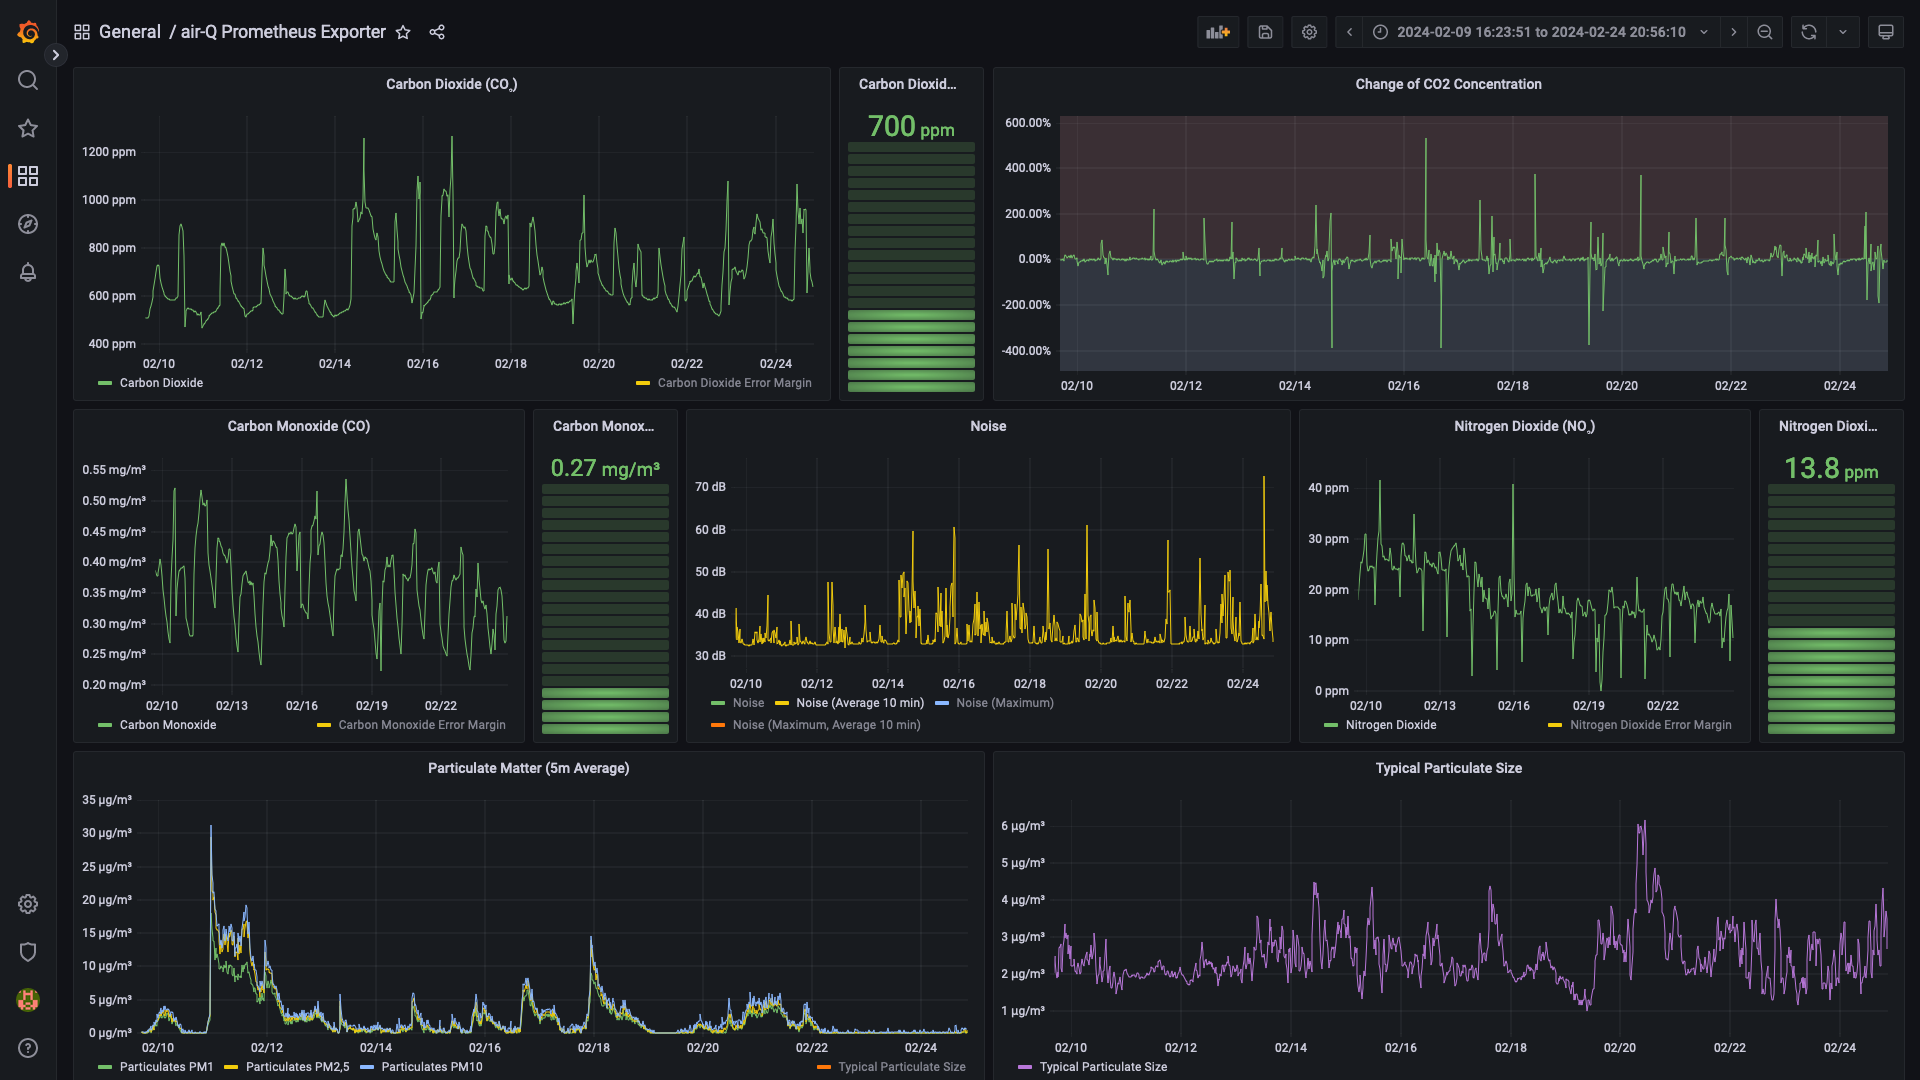
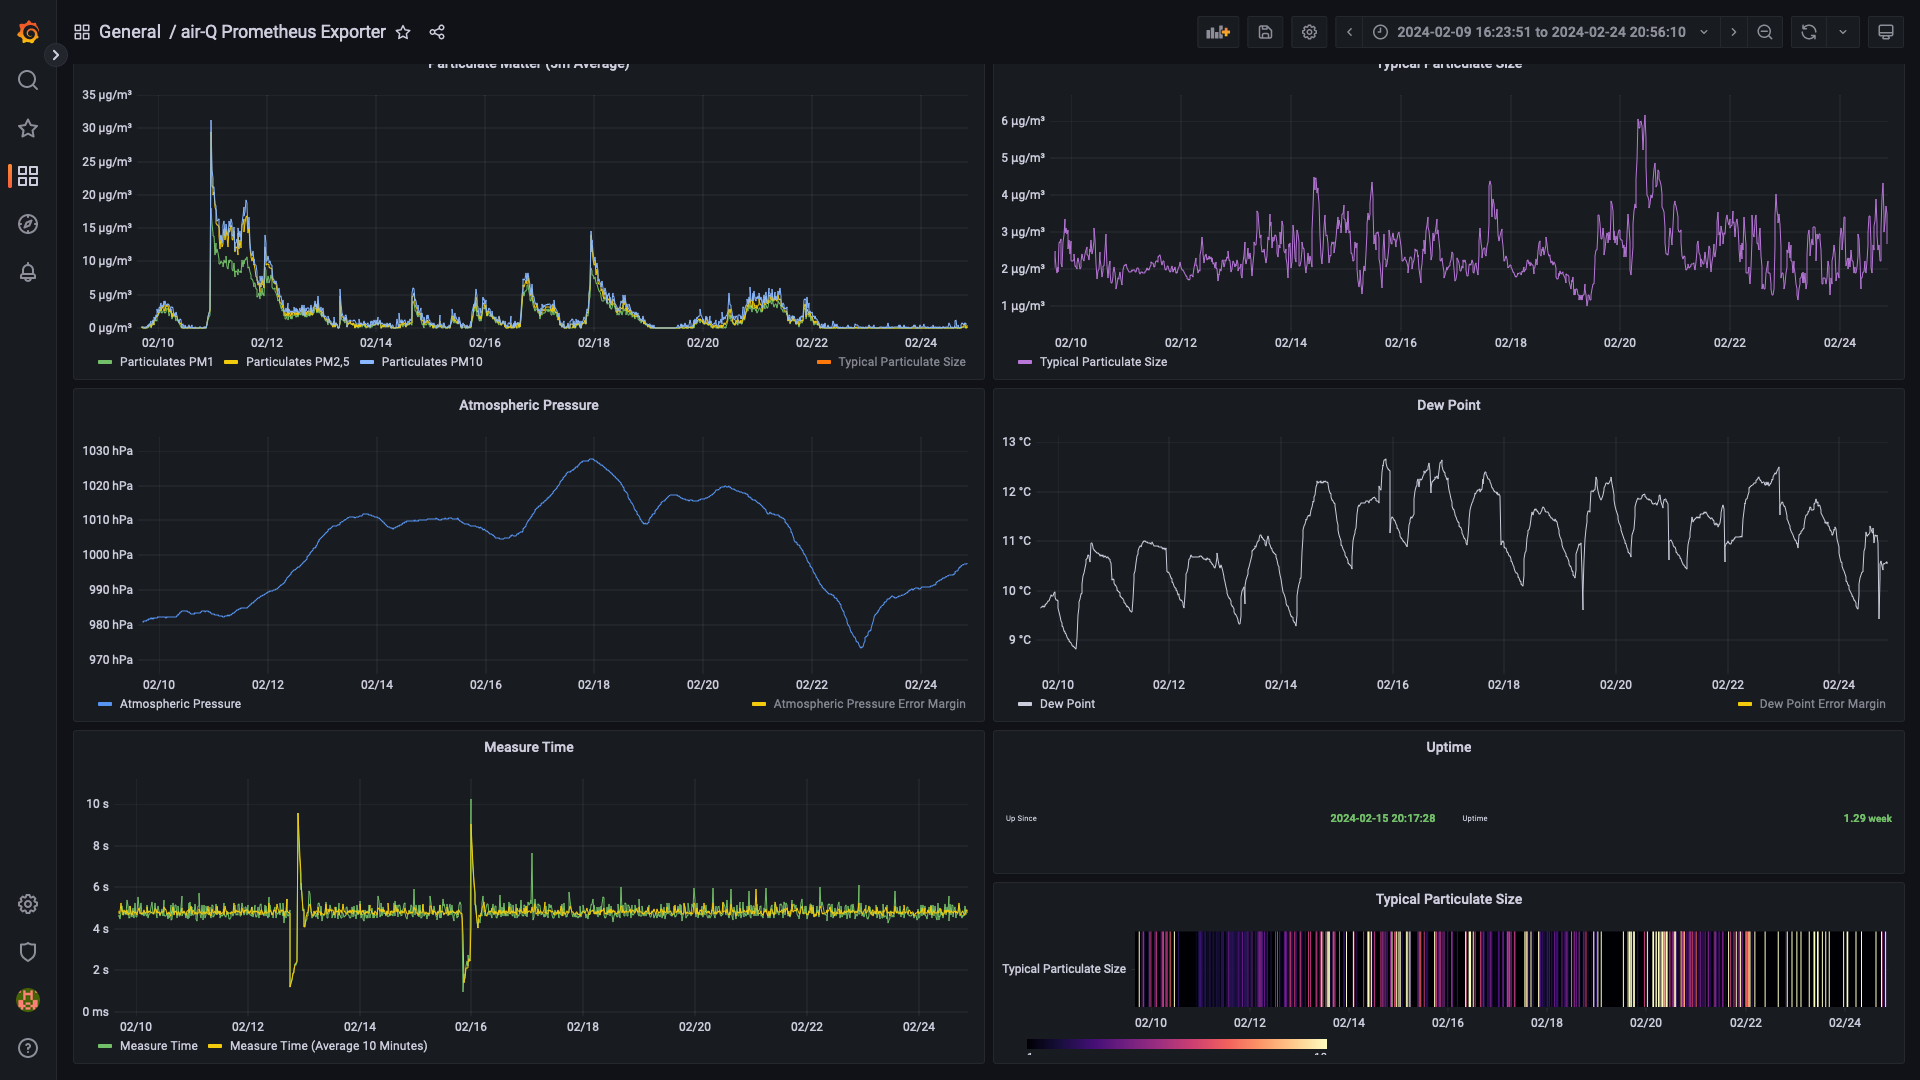
The Grafana dashboard has visualizations for the air-Q pro that comes with 14 sensors. The following metrics are supported:
| Metric | English Name | German Name | Unit | Type | Has Error Margin? |
|---|---|---|---|---|---|
| health | Health | Gesundheitsindex | % | double | no |
| performance | Performance | Leistungsindex | % | double | no |
| virus | Virus-free Index | Virenfrei-Index | % | double | yes |
| mold | Mold-free Index | Schimmelfrei-Index | % | double | yes |
| no2 | Nitrogen Dioxide | Stickstoffdioxid | µg/m³ | double | yes |
| co2 | Carbon Dioxide | Kohlendioxid | ppm | double | yes |
| sound | Noise | Lärm | dB(A) | double | yes |
| sound_max | Noise (Maximum) | Lärm (Maximum) | dB(A) | double | yes |
| tvoc | VOC | VOC | ppb | double | yes |
| humidity | Relative Humidity | Relative Luftfeuchtigkeit | % | double | yes |
| co | Carbon Monoxide | Kohlenmonoxid | mg/m³ | double | yes |
| humidity_abs | Absolute Humidity | Absolute Luftfeuchtigkeit | g/m³ | double | yes |
| temperature | Temperature | Temperatur | °C | double | yes |
| pm1 | PM1 Particulate Matter | PM1 Feinstaub | µg/m³ | double | yes |
| pm2_5 | PM2.5 Particulate Matter | PM2.5 Feinstaub | µg/m³ | double | yes |
| pm10 | PM10 Particulate Matter | PM10 Feinstaub | µg/m³ | double | yes |
| pressure | Air Pressure | Luftdruck | hPa | double | yes |
| dewpt | Dew Point | Taupunkt | °C | double | yes |
| TypPS | Typical Particulate Size | Typische Partikelgröße | µm | double | no |
| dCO2dt | Change of CO₂ concentration | Änderung der CO₂ Konzentration | ppb/s | int | no |
| dHdt | Change of Humidity | Änderung der Luftfeuchtigkeit | mg/m3/s | int | no |
| measuretime | Duration of measurement | Dauer der Messung | ms | int | no |
| timestamp | Timestamp | Timestamp | long | no | |
| uptime | Uptime | Uptime | s | long | no |
| Status | Status | Status | string | no |
Data source config
Collector type:
Collector plugins:
Collector config:
Revisions
Upload an updated version of an exported dashboard.json file from Grafana
| Revision | Description | Created | |
|---|---|---|---|
| Download |
Metrics Endpoint (Prometheus)
Easily monitor any Prometheus-compatible and publicly accessible metrics URL with Grafana Cloud's out-of-the-box monitoring solution.
Learn more